Hi.
I'm ploting a pca in R, but I don't know how to format subscripts to the names of environmental variables in the ordination plot, someone can help me?
Then use the text() function to add text to a plot at xy coordinates. However, if this is a one-off plot you need to do, I think is going to be easier to save the graph as pdf and edit the numbers manually in, say, Inkscape, especially if you have numbers that should be subscripted and others that shouldn't.
Hi all, I am using PCA function from `FactoMineR` package, which they return these 2 dataframes: "`$var$coord`" "coord. for the variables" "`$var$contrib`" "contributions of the …
Hi, I was able to plot the PCA between two different variables using function autoplot() function from ggfortify library. I have a question about how …
Essentially I am trying to re-create a database with three classes of exons. 1. Constitutively Spliced Exons 2. Alternatively Retained Exons 3. Alternatively Skipped Exons …
May be, like this Subscripts in R plots
Hi, I need subscript NO3 in plot, not in the x or y title, like this;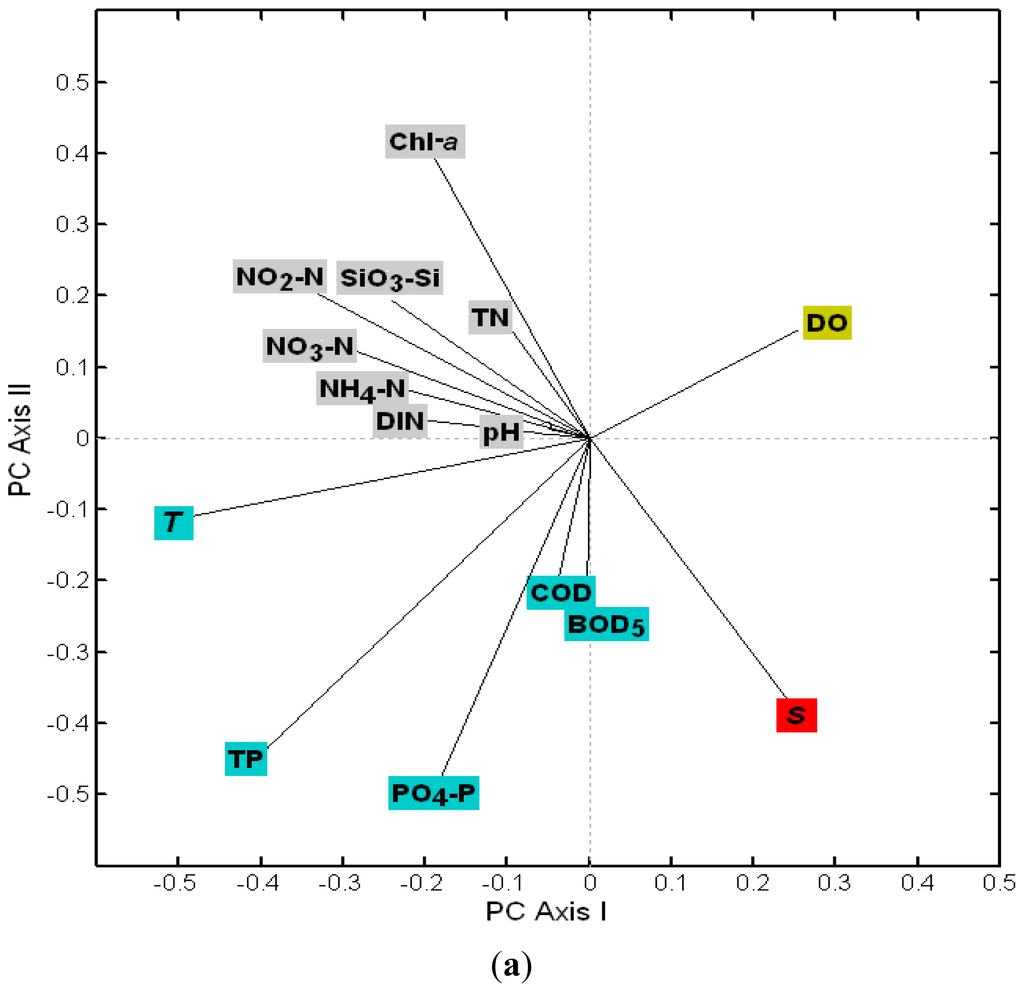
Then use the text() function to add text to a plot at xy coordinates. However, if this is a one-off plot you need to do, I think is going to be easier to save the graph as pdf and edit the numbers manually in, say, Inkscape, especially if you have numbers that should be subscripted and others that shouldn't.
Hello Daniel C.!
We believe that this post does not fit the main topic of this site.
This is a pure R question. Please check stackoverflow.
For this reason we have closed your question. This allows us to keep the site focused on the topics that the community can help with.
If you disagree please tell us why in a reply below, we'll be happy to talk about it.
Cheers!