This is a test version of Biostars. For the public version, visit https://www.biostars.org.
CollectInsertSizeMetrics - changing DEVIATIONS gives different results -

Hi,

I was running CollectInsertSizeMetrics on the output file from Bowtie2 and changing the parameter DEVIATIONS I got totally different results for MEAN_INSERT_SIZE and for STANDARD_DEVIATION.

e.g.

for DEVIATIONS=200.0

  • MEAN_INSERT_SIZE = 2302,200903
  • STANDARD_DEVIATION = 1026,875768

for DEVIATIONS=10.0 (default)

  • MEAN_INSERT_SIZE = 491,421658
  • STANDARD_DEVIATION = 338,674711

(data: Illumina mate pair with, as company said, insert size of 3kb)

So, I would like to know which value should I set up for DEVIATIONS and how one decide which value to use?

Thank you!

Vlad

assembly alignment genome next-gen sequence

3 answers

I suggest using the median or mode when quantifying they typical insert size of a library; they are usually more stable than the average.

You should plot your insert size histogram. I suspect you have the majority of them at the 500bp range, so with the default DEVIATIONS setting, your biggest inserts are not used in the calculation. When increasing DEVIATIONS, CollectInsertSizeMetrics uses a wider range of your data to calculate the metrics. Here is the description of the DEVIATIONS effect:

Generate mean, sd and plots by trimming the data down to MEDIAN + DEVIATIONS*MEDIAN_ABSOLUTE_DEVIATION. This is done because insert size data typically includes enough anomalous values from chimeras and other artifacts to make the mean and sd grossly misleading regarding the real distribution. Default value: 10.0. This option can be set to 'null' to clear the default value.

Thank you for the answers! I didn't specify enough precisely what I did. So I'll give a bit more details, I used Bowtie2 with following parameters: sensitive local, Paired-end with the minimum fragment length for valid paired-end alignments of 1000 X 7000 and RF orientation. Sequencing company said that the insert size should be 3kb. After I run CollectInsertSizeMetrics and I got this:

For DEVIATIONS=200.0

MEDIAN_INSERT_SIZE   MEDIAN_ABSOLUTE_DEVIATION   MIN_INSERT_SIZE   MAX_INSERT_SIZE   MEAN_INSERT_SIZE   STANDARD_DEVIATION   READ_PAIRS   PAIR_ORIENTATION   WIDTH_OF_10_PERCENT   WIDTH_OF_20_PERCENT   WIDTH_OF_30_PERCENT   WIDTH_OF_40_PERCENT   WIDTH_OF_50_PERCENT   WIDTH_OF_60_PERCENT   WIDTH_OF_70_PERCENT   WIDTH_OF_80_PERCENT   WIDTH_OF_90_PERCENT   WIDTH_OF_99_PERCENT   SAMPLE   LIBRARY   READ_GROUP
195                  75                          20                189978034         206,006297         311,891541           4474205      FR                 39                    71                    99                    125                   151                   179                   209                   241                   275                   344899                                    
2029                 202                         20                190915366         2302,200903        1026,875768          83024669     RF                 73                    145                   221                   307                   405                   529                   719                   1105                  2569                  9249

For DEVIATIONS=10.0

MEDIAN_INSERT_SIZE   MEDIAN_ABSOLUTE_DEVIATION   MIN_INSERT_SIZE   MAX_INSERT_SIZE   MEAN_INSERT_SIZE   STANDARD_DEVIATION   READ_PAIRS   PAIR_ORIENTATION   WIDTH_OF_10_PERCENT   WIDTH_OF_20_PERCENT   WIDTH_OF_30_PERCENT   WIDTH_OF_40_PERCENT   WIDTH_OF_50_PERCENT   WIDTH_OF_60_PERCENT   WIDTH_OF_70_PERCENT   WIDTH_OF_80_PERCENT   WIDTH_OF_90_PERCENT   WIDTH_OF_99_PERCENT   SAMPLE   LIBRARY   READ_GROUP
195                  75                          20                189978034         190,24033          92,819304            4474205      FR                 39                    71                    99                    125                   151                   179                   209                   241                   275                   344899                                    
2029                 202                         20                190915366         491,421658         338,674711           83024669     RF                 73                    145                   221                   307                   405                   529                   719                   1105                  2569                  9249

So I would expect median or/and mean to fit prediction provided by company (3kb). For the median results seem to be ok, even though they are for 1kb less than expected. In the case when DEVIATIONS is set up to default value of 10 mean is far away from the expected value. In the other case (DEVIATIONS=200) median and mean are very similar and it show better fit to the expected value. As they said in description:

This is done because insert size data typically includes enough anomalous values from chimeras and other artifacts to make the mean and sd grossly misleading regarding the real distribution.

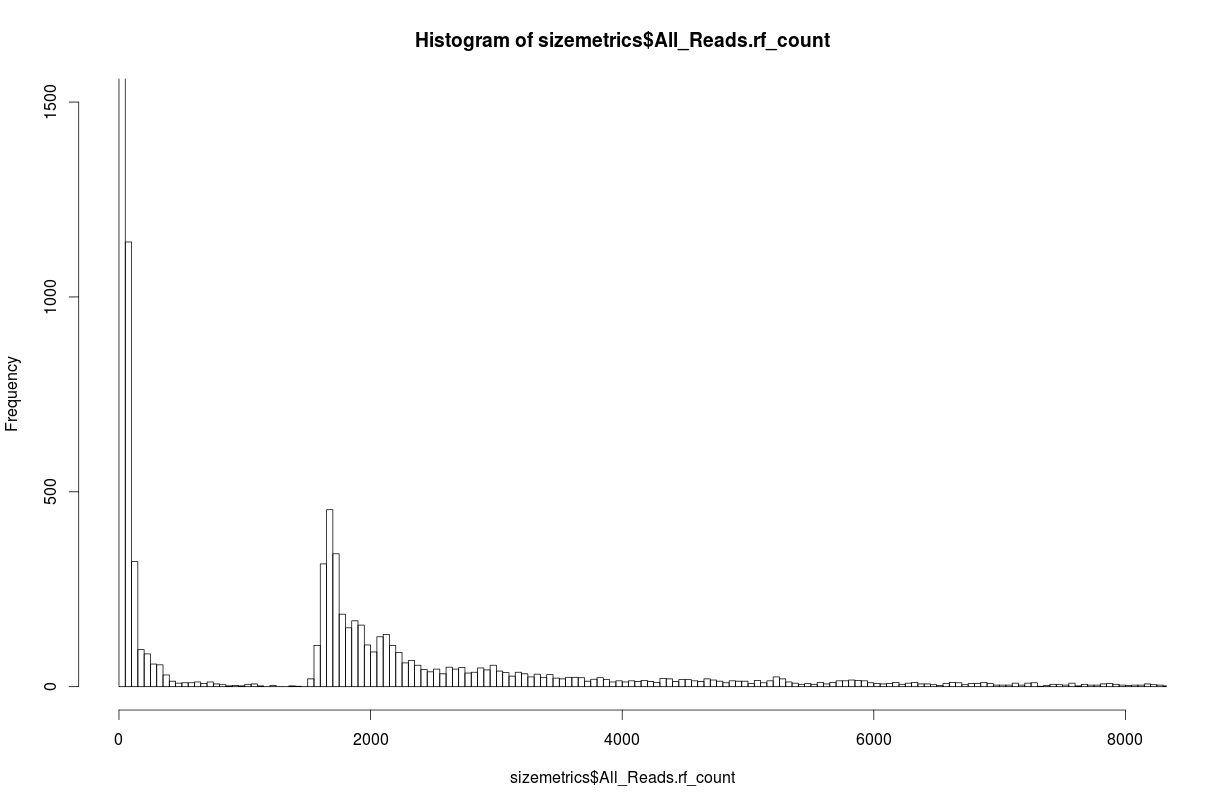
This is a histogram (for some reason Galaxy didn't produce a histogram, so I made it in R):

EDIT: Image moved to imgbb by Ram on 24-Jan-2023
histogram

It is obvious that many of them have very small insert size, and I am not sure if I should be concerned about this.

Your histogram did not show up here. I do not have much experience with mate-pair library prep and sequencing, but I know its quality may be highly variable. You should check the orientation of the mapped pairs, proper mate-pairs should have RF orientation, if during the junction enrichment step the biotinylated adapter are not properly rescued, there will be carry-over of wrong fragment reads, but they will map mostly with FR orientation.

I'm very new here and I have no idea why hist didn't show up (maybe there is a specific way to upload pic and I just copy-pasted it). Regarding orientation of the mapped pairs, I know that it is very important to take care of orientation when dealing with mate-paired libraries. A sequencing company took care of trimming and separating mate pairs from Illumina reads and they sent us mate pairs in two separate files for each line. And I did take care about orientation in the following steps. In the table I pasted results for RF reads are in bold. However, I will double check if company separated trimmed accordingly to: http://www.illumina.com/documents/products/technotes/technote_nextera_matepair_data_processing.pdf but still, as you said even if reads are close to each other as it is in Figure2 c and e (from the link), they would be in FR orientation and not RF as it is in my data. Since my reference genome is not the same species I'm working on, I can expect to have some reads that are mapping to different chromosomes and they will be in the category "0" by default, but still there are a lots of reads with very small insert size (less than 500).

EDIT: Image moved to imgbb by Ram on 24-Jan-2023.

image: histogram

To post images, upload them to imgur and use the link here.

As I said earlier, I do not much experience with mate-pair. But looking here, one can see the simple protocol will generate a widespread insert distribution, the "dual" protocol with a second selection on gel has a narrower distribution. I don't know which you paid for.

Here is the histogram. I came across that paper also but I have no information about technique that company used for the insert size selection. I came in the lab and they already had everything sequence long ago. I also think that knowing the method for insert size selection would help in determining anomalies in insert size distribution, but looking at this histogram I would say that there is something weird going on regardless the method.

histogram

Indeed, it seems your mate pairs have an abnormal bimodal distribution. Well, if the sequencing was done long ago, maybe it is too late to complain anyway. I would use the mate pairs from 1.5kbp to 6kbp or 8kbp, and discard the extremities of the distribution. You may discard perfectly good pairs, but at least you are erring on the conservative side.

Anyway, I do not know against what you did your mapping (close genome, preliminary assembly of your reads), so maybe there is a biological explanation for the mate-pairs distribution?

So, the genomes are not that close. The estimated divergence time between them is about 8 Myr. I would definitely discard the extremities of the distribution, but the problem is that I am interested in structural rearrangements. I am trying to discover them using exactly those mate pairs that are not in expected range of insert size distribution. Even though I am expecting to see some of the reads far away from the expected insert size, I would not expect to see them concentrated around zero. In this very particular case I would expect to see this pattern: if there is some rearrangement that is very similar in size to expected insert size (~2kb) and if it is well covered).

e.g.

distance between same letters is around 2kb (where each letter represent a read from the same mate-pair. e.g. a and A).

a b c d e f A B C D E F

when reverted

f e d c b a A B C D E F

if cbaABC region is with a much higher coverage than the rest of the sequence I would expect to see a peak around zero and decrease towards higher values of insert size until it reaches a point where there are reads with expected insert sizes.

However, this scenario doesn't appear very likely to me because of the mate pair orientation, and because of the number of the reads that are with an insert size below 500bp. Currently I am trying to figure out if there is any pattern in distribution of this reads (insert size below 500bp) over the genome. If they are equally spread over the genome it might indicate that there is an issue with the library prep.

Do you have enough data do perform an assembly? An alternative / complementary approach could be comparing synteny between the genomes.

We don't have coverage good enough to do de novo assembly. Anyway thanks for suggestions, it was helpful!

Log in to answer this question.