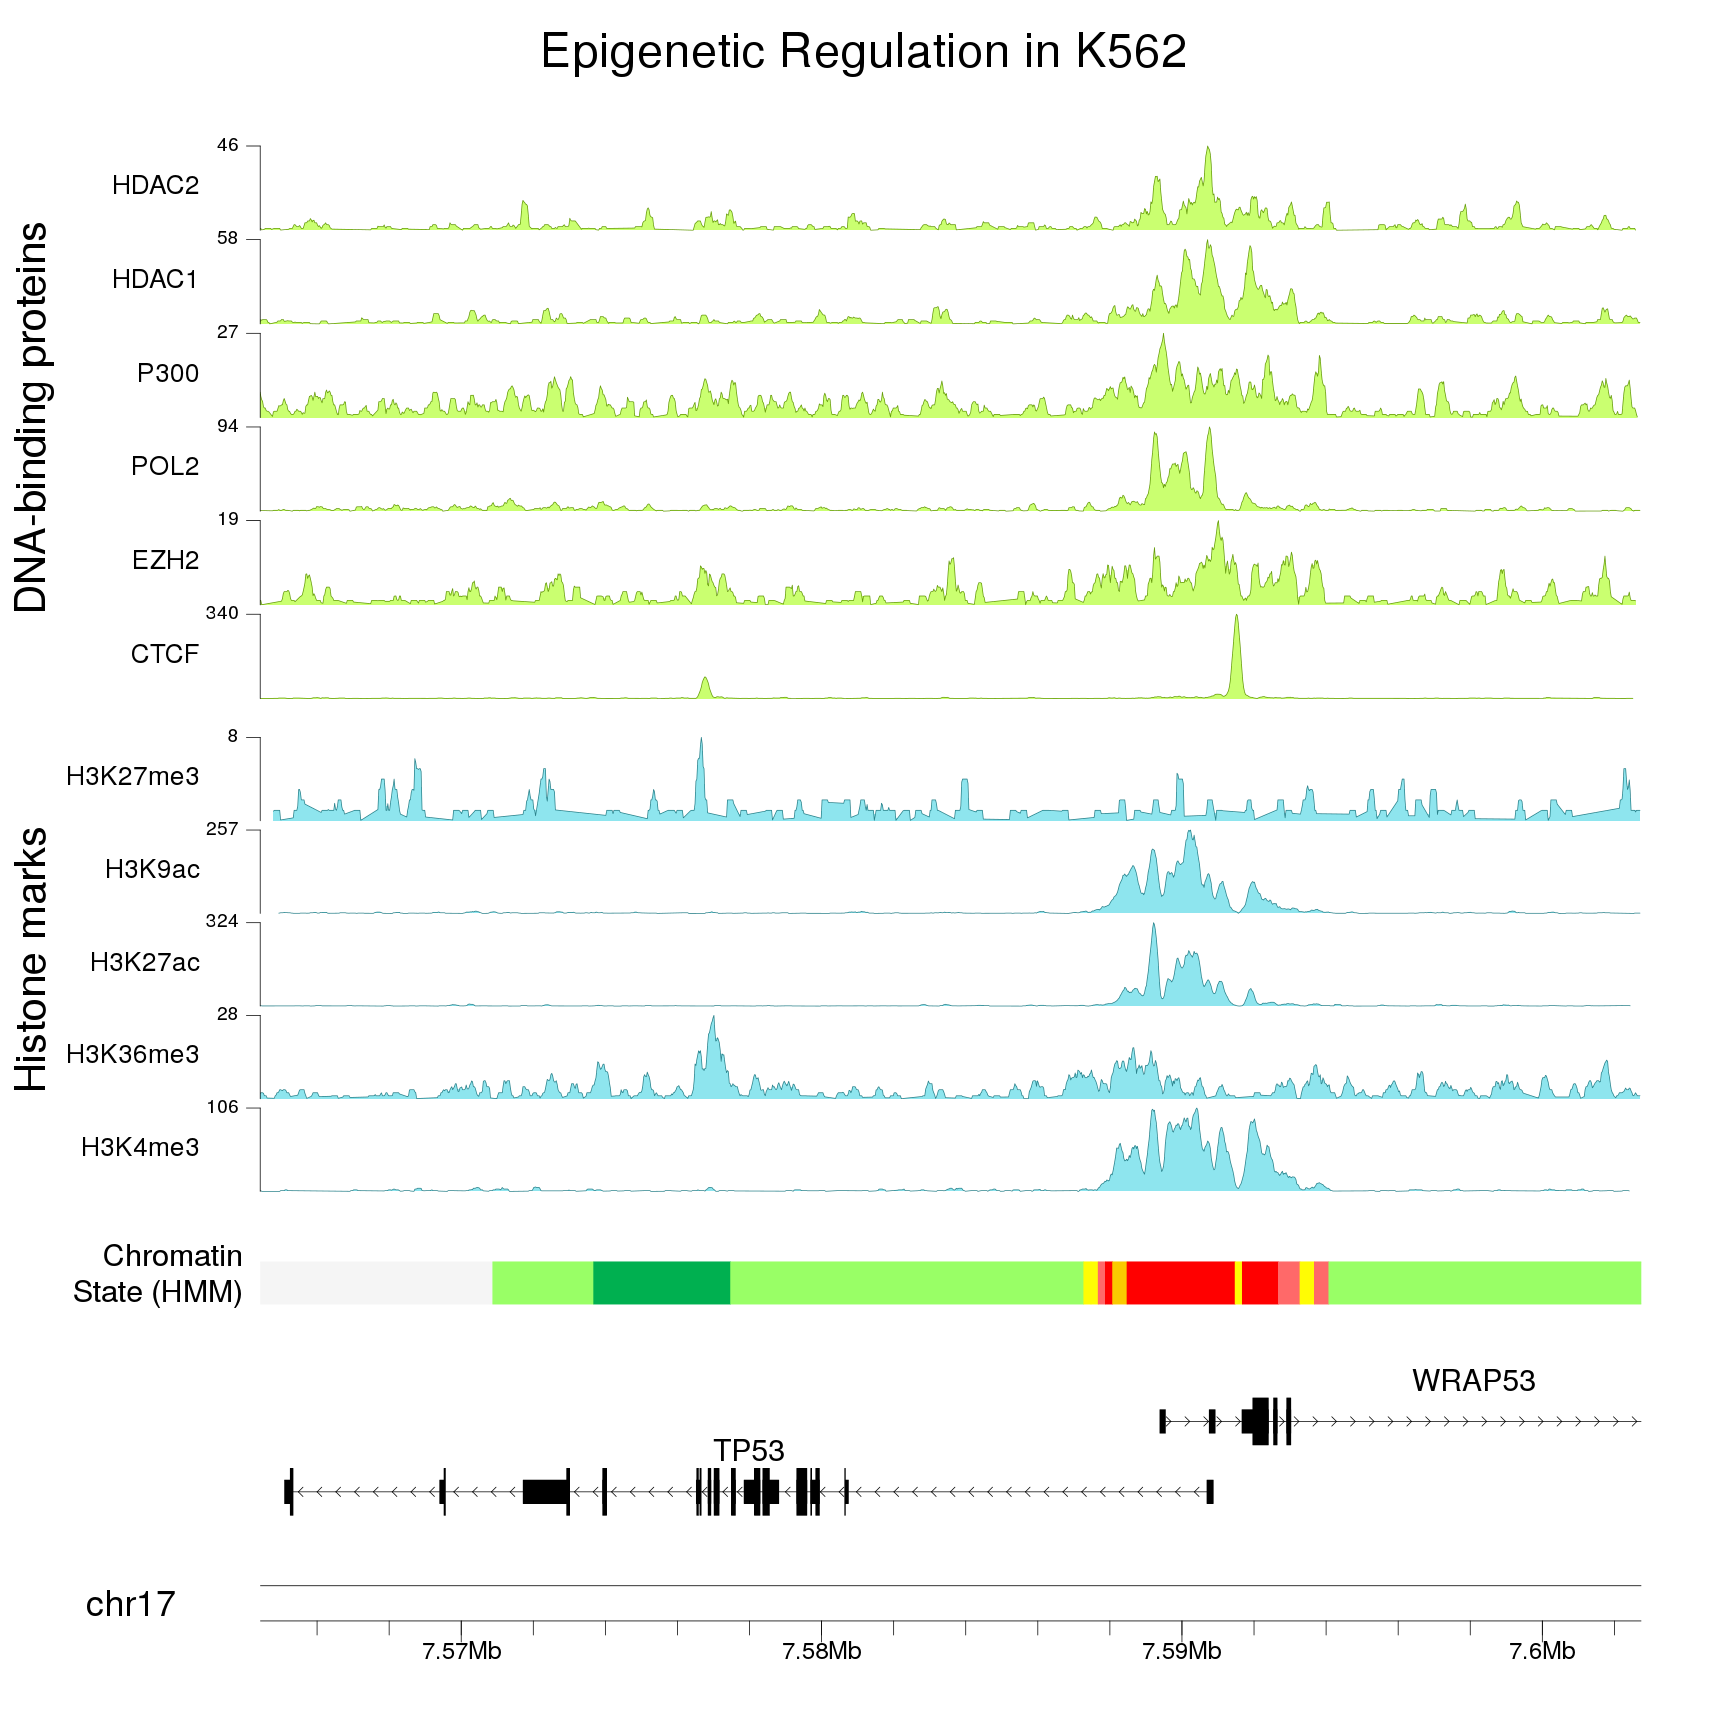
I would like to create a nice figure illustrating, for example, different histone modifications on a given region. An example of what I wish to create is the , which is from a random article.
My workplace has previously used Nimblegens SignalMap browser. SignalMap produces quite nice end results, but is rather cumbersome to work with.
I have looked into IGV, which seems a lot more advanced, but I haven't yet been able to create as nice figures with it as with SignalMap.
I'm wondering what's the most popular general purpose genome browser around (for mammalian genomes). Is it common to use the genome browser to produce article quality figures?
edit: I was unable to insert the picture, I'll try to link it instead.
I am quite confident that the figure was brushed up with a graphics program. None of the genome browsers I know have this nice positioning of the track descriptions at the right within the track. The scale on the left also shows just the maximum and no 0, I guess most browsers show some tick marks in between.
If you want a really nice figure, you need to save the output of a genome browser as SVG or PDF (PS) and rework it a little bit e.g. inkscape or adobe illustrator.
The most popular is I guess UCSCs genome browser, but popularity does not equal nice figures.
From UCSC genome browser you can export to PS or PDF (click PDF/PS in the top bar) and then edit with a vector graphics editing program like Illustrator or Inkscape. I would recommend tweaking the browser settings to remove light blue gridlines prior to export.
From IGV you can export a few types of images, including svg, but I personally don't think the figures end up looking as good.
Since this question has been resurrected, I'll add karyoploteR to the list of available tools. It's an R/Bioconductor package to plot data on genomes and can work with BAM files or BigWigs (and many other formats, actually).
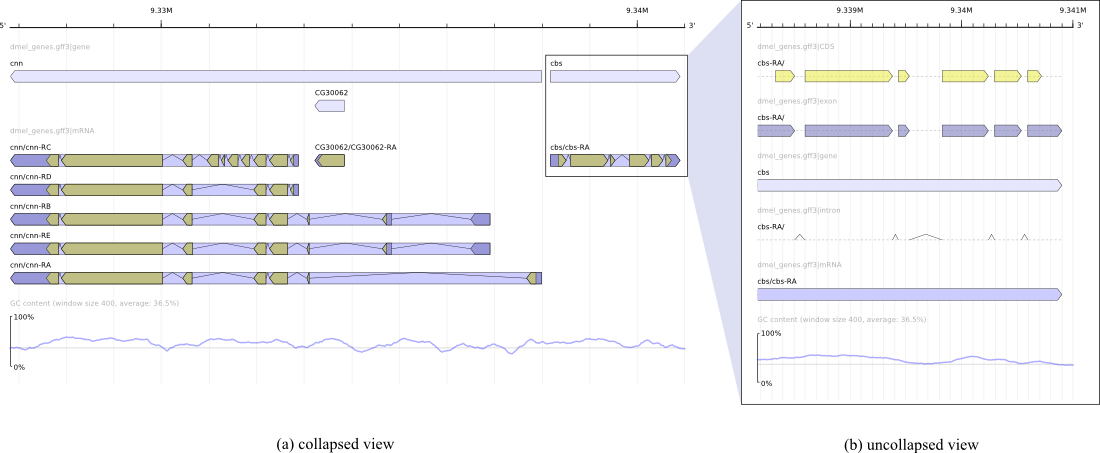
I know this answer comes late, but I came over this question myself just recently searching for tools to do what you want (so I guess other people might do the same).
I've now tried a few tools, and from my experience these two work really well:

 , which is from a random article.


Great suggestion. Thanks!