that is a nice solution there
• 0 views
•
link
I am stuck with a very simple problem. I want to build a Pearson correlation matrix for my microarray dataset. My .cvs file consists of normalized, log-transformed expression values of 18k genes across 36 samples. I want to find the gene-gene Pearson correlation from this matrix using R package. After that, I want to transform the matrix to the form of an edge-list with genes in the first two columns and the value of the correlation in the last column. I was trying out the cor() function in R, but I guess there is some issue with numeric/character values because of which it gives me the error x has to be numeric. Kindly give some suggestions as to what way I can read in the file and transform the matrix.
Thanks
Gene sample1 sample2 sample3
A    10      50      78
B    50      45      55
C    70      56      44
Use my script taxo_bivariate_plot.R. It uses cor() as suggested by Phil S. Usage information is as follows:
$ Rscript taxo_bivariate_plot.R --help
Usage: taxo_bivariate_plot.R [options] file
Options:
    --ifile=IFILE
        CSV file
    --opath=OPATH
        Output path
    --fsize=FSIZE
        Font size [default 1.2]
    --width=WIDTH
        Width of jpeg files [default 800]
    --height=HEIGHT
        Height of jpeg files [default 800]
    --correlation=CORRELATION
        Correlation to use: 1=pearson, 2=spearman, 3=kendall [default 1]
    --rmode
        Mode: TRUE=R mode, FALSE=Q mode [default FALSE]
    -h, --help
        Show this help message and exit
This script generates bivariate plots with histograms on the diagonals, scatter plots with smooth curves below the diagonals and correlations with significance levels above diagonals. Data file has the following organization:
         Var_1 Var_2 Var_3 .. Var_R
Sample_1
Sample_2
Sample_3
...
Sample_N
For example,
$head ENV_pitlatrine.csv
Samples,pH,Temp,TS,VS,VFA,CODt,CODs,perCODsbyt,NH4,Prot,Carbo
T_2_1,7.82,25.1,14.53,71.33,71,874,311,36,3.3,35.4,22
T_2_10,9.08,24.2,37.76,31.52,2,102,9,9,1.2,18.4,43
T_2_12,8.84,25.1,71.11,5.94,1,35,4,10,0.5,0,17
T_2_2,6.49,29.6,13.91,64.93,3.7,389,180,46,6.2,29.3,25
T_2_3,6.46,27.9,29.45,26.85,27.5,161,35,22,2.4,19.4,31
T_2_6,7.69,28.7,65.52,7.03,1.5,57,3,6,0.8,0,14
T_2_7,7.48,29.8,36.03,34.11,1.1,107,9,8,0.7,14.1,28
T_2_9,7.6,25,46.87,19.57,1.1,62,8,13,0.9,7.6,28
T_3_2,7.55,28.8,12.65,51.75,30.9,384,57,15,21.6,33.1,47
$ Rscript taxo_bivariate_plot.R --ifile=ENV_pitlatrine.csv
Will generate the following image:
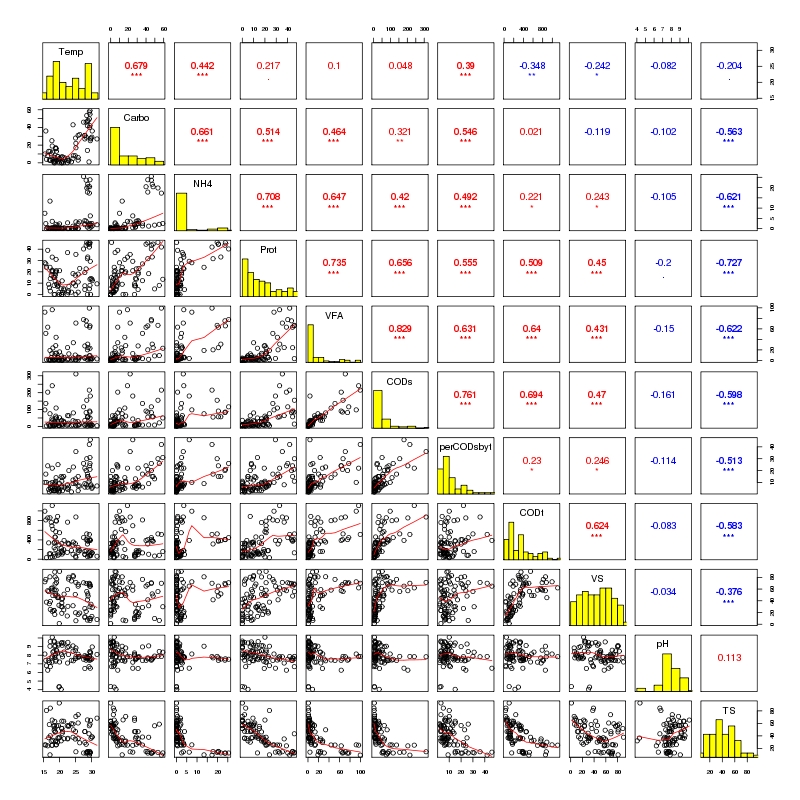
This Rscript is back-end of my TAXAenv website. You can use --rmode to transpose your matrix and change the script accordingly to meet your needs.
Best Wishes,
Umer
It is not clear what you mean by gene-gene correlation. If you were to compare each gene to every other other one there will be about N*N correlations to compute. Then you'll end up with a large list of values that again need to be processed to make any sense of.
If you want to select genes that are most similar to one another then hierarchal clustering (with say correlation as its metric) is the way to go.
Log in to answer this question.
I think the
cor()function is trying to also use the geneName (column 1) to infer correlations, have you triedcor(myData[,-1])to calculate it? Also have a look at the vigniette of the {stats} package!Thanks..just a query..as I have to find correlations between A&B..B&C..etc...I read somewhere that R works column wise..so I used cor(t(myData[,-1]))..to transform the matrix...am I doing right ? Another issue is this way I am loosing all the row and column headings ..
to transpose your data is, in general, just fine. Please have in mind the comment from Istvan Albert.