Copy number variation plot
Hi guys,
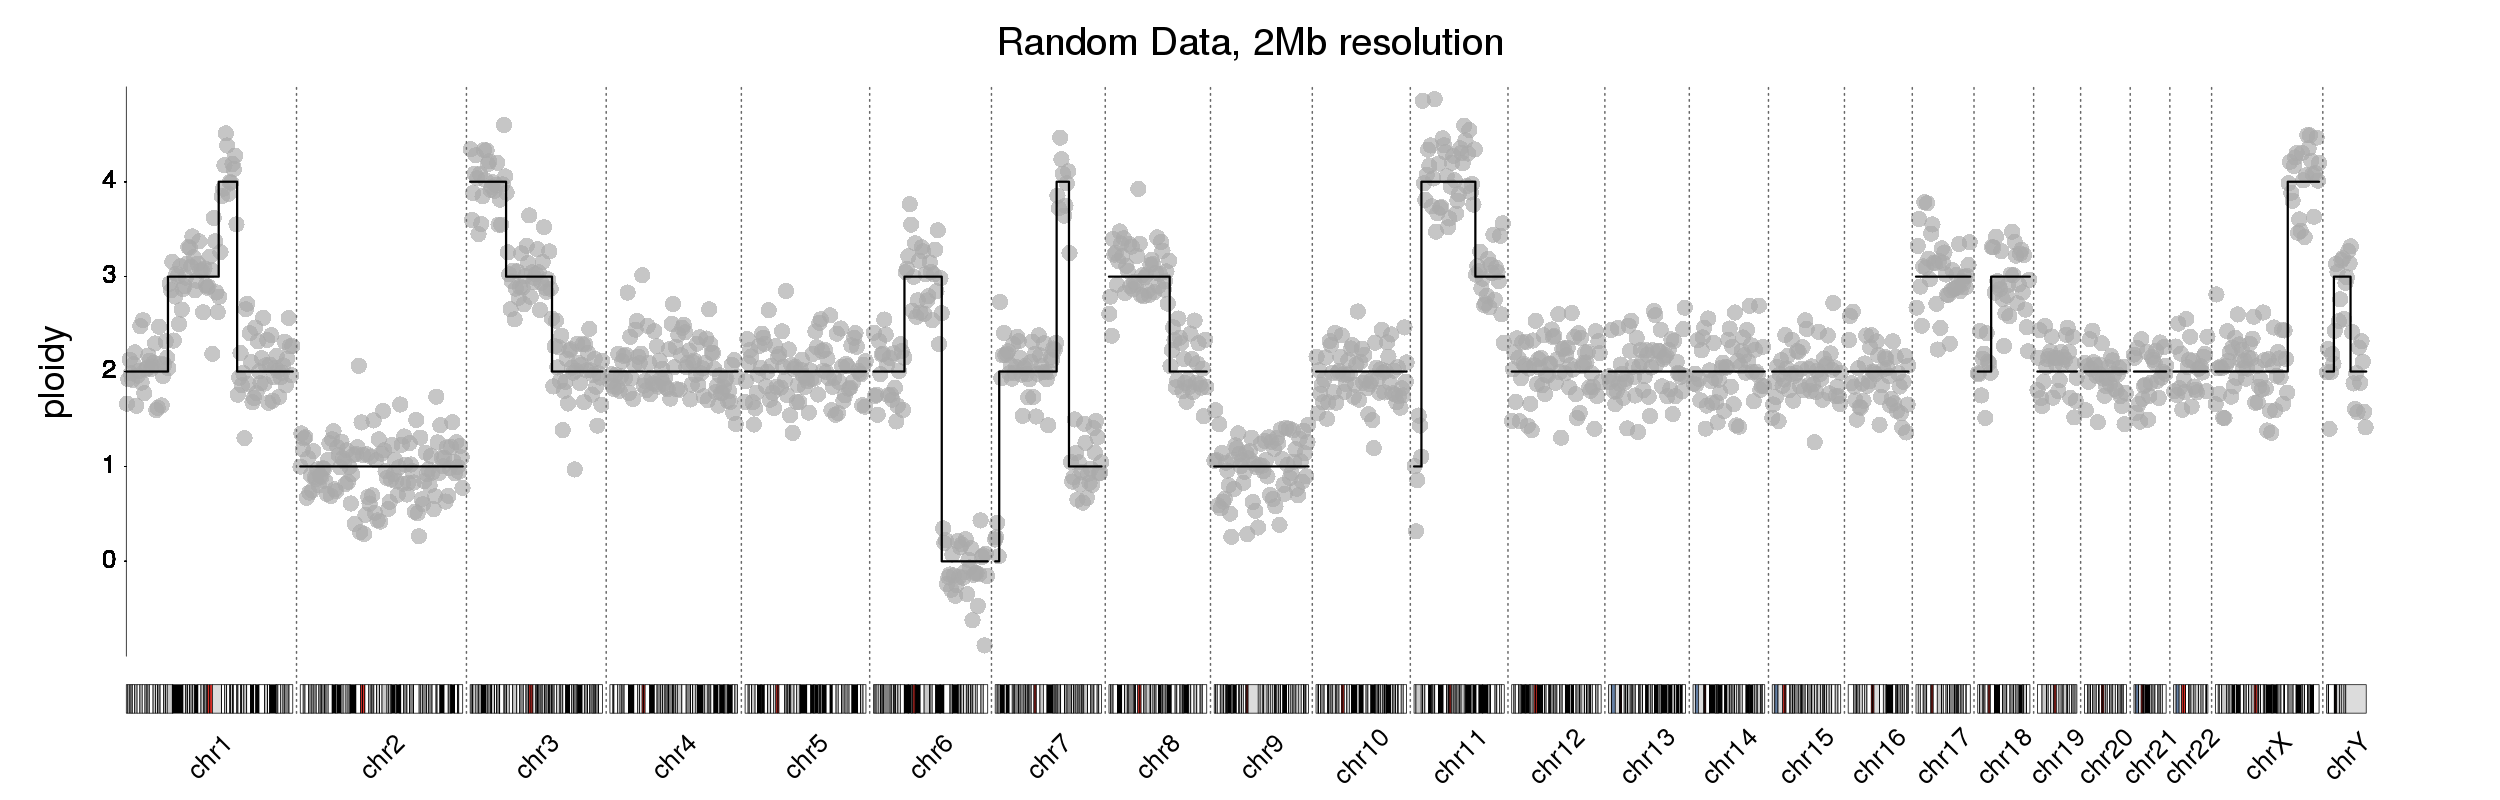
I am looking to create a plot like this. There has been a previous post on the forum on this with the plot from @bernatgel. I loved the solution but am unable to translate it to my data. Maybe someone knows?
I am looking to create this plot using karyoploteR.
My dataset looks like this (with made up examples below):
- chromosome number
- start: denotes start position of copy number variation
- end: denotes the end position of the variation on the chromosome
- ploidy
log2_ratio
chromosome         start            end               ploidy
  1                 58865614        58865899          3.512352
  2                 14538784873     14538784998       3.512352
  4                 83948882        839497809         3.512352
  4                 82748427        827486789         3.512352
How do I adapt the code below, to work on my dataset?
kp <- plotKaryotype("hg19", plot.type = 4, labels.plotter = NULL, main="Random Data, 2Mb resolution", cex=3.2)
kpAddChromosomeNames(kp, srt=45, cex=2.2)
plotLRR(kp, tiles, ymin=-1, ymax=5, labels = NA,  points.col = "#AAAAAAAA", line.at.0 = FALSE, points.cex = 3, add.axis = FALSE)
plotCopyNumberCallsAsLines(kp, cn.calls = rr, ymin=-1, ymax=5, lwd=3, add.axis=FALSE, labels = NA)
kpAddChromosomeSeparators(kp, lwd=2, col = "#666666")
kpAxis(kp, ymin = -1, ymax=5, tick.pos = 0:4, cex=2.2)
kpAddLabels(kp, labels = "ploidy", cex=3, srt=90, pos=3, label.margin = 0.025)
Help would be greatly appreciated!
• 706 views
•
link
0 answers
No answers yet.
Log in to answer this question.