pyGenomeViz is a genome visualization python package for comparative genomics implemented based on matplotlib. This package is developed for the purpose of easily and beautifully plotting genomic features and sequence similarity comparison links between multiple genomes. It supports genome visualization of Genbank/GFF format file and can be saved figure in various formats (JPG/PNG/SVG/PDF/HTML).
pyGenomeViz API and CLI enable users to plot the following figures.
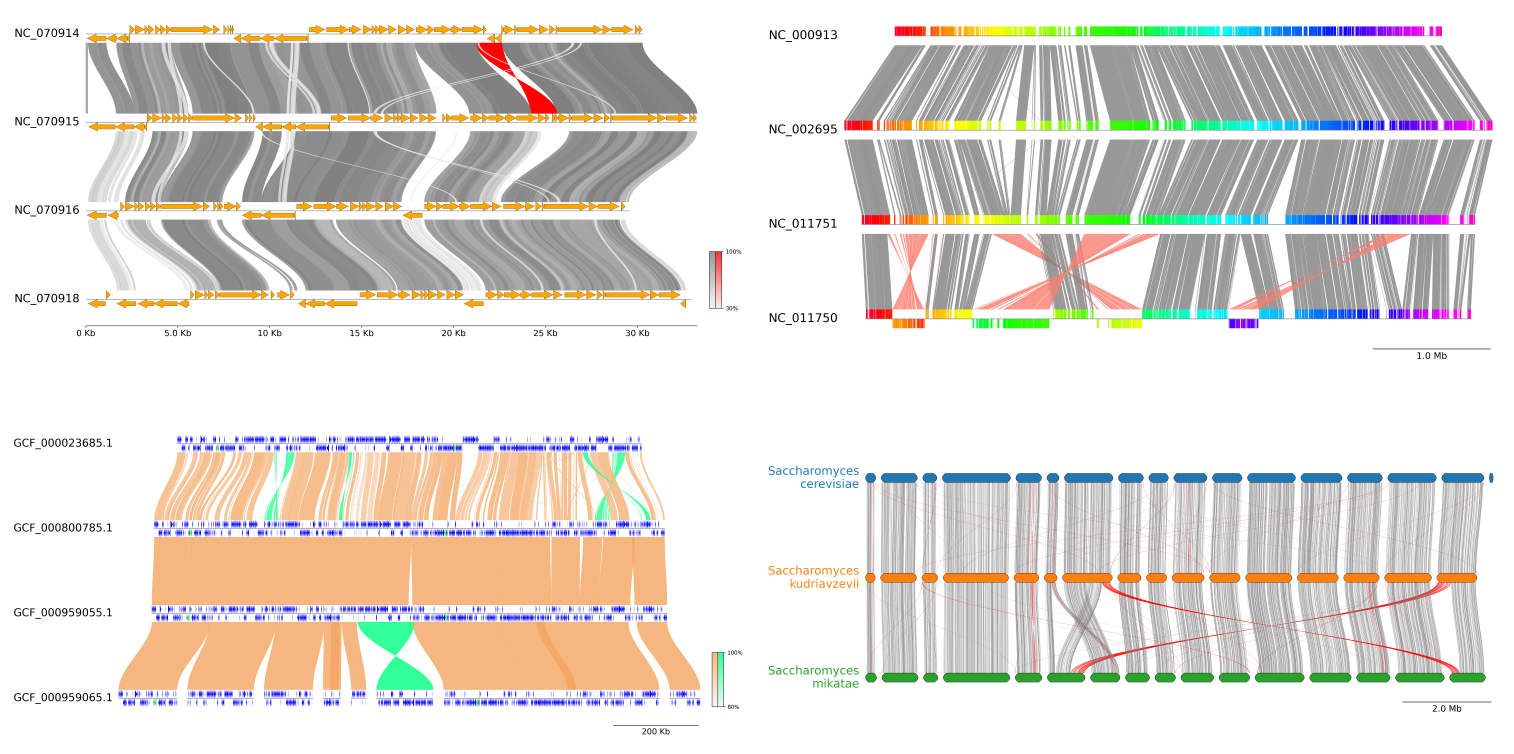
Fig.1 pyGenomeViz example plot gallery
pyGenomeViz GUI (Web Application) enables users to plot comparative genome figure from Genbank files interactively and easily as shown below.

Fig.2 pyGenomeViz GUI (Web Application) example (Demo Page)
pyGenomeViz provides a simple and easy-to-use HTML viewer as an output result as shown below.
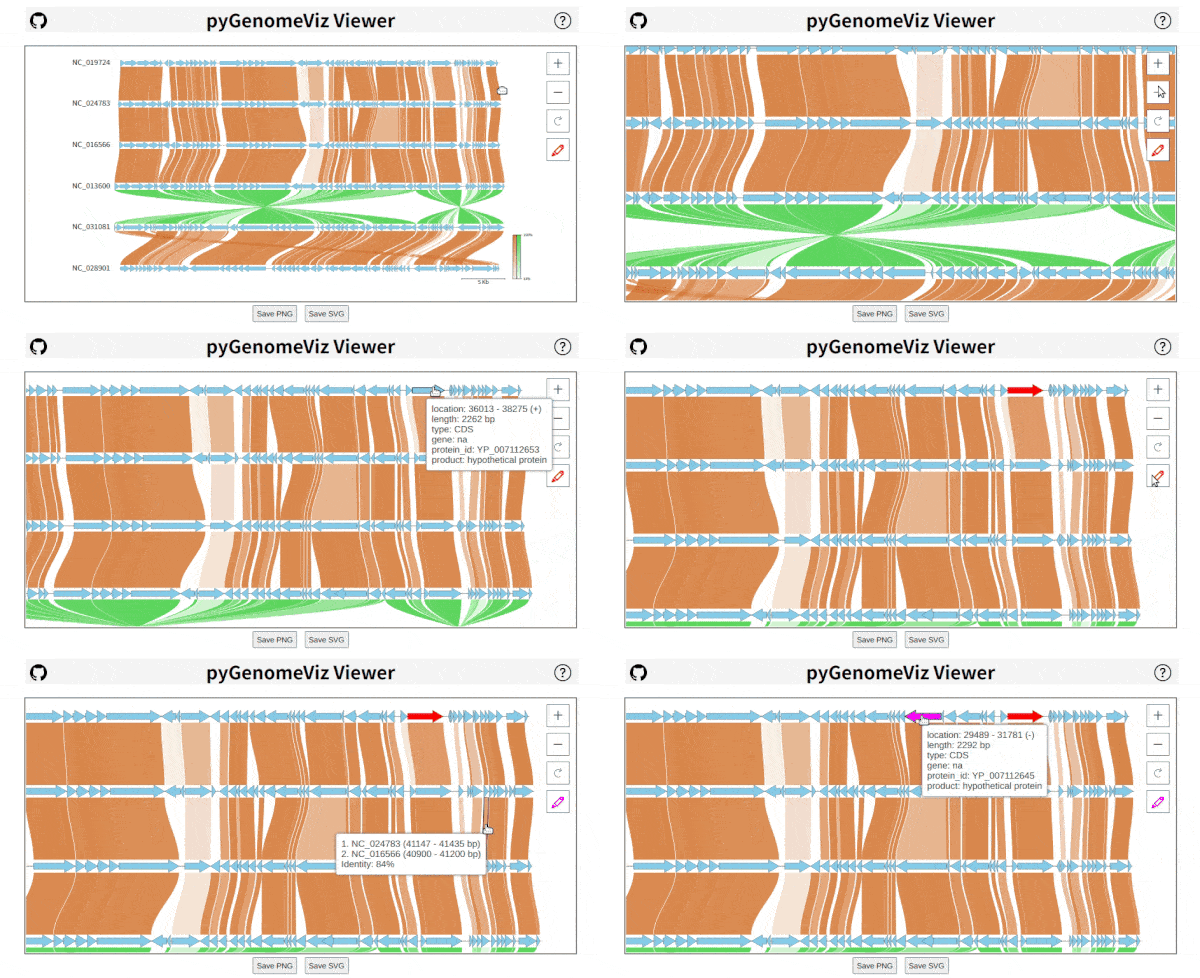
Fig.3 pyGenomeViz HTML viewer example (Demo Page)
0 answers
No answers yet.
Log in to answer this question.
Very nice package! I am trying to build something similar for R: geneviewer