How to make Cicero Spider Plot
Hello, I have a list of enhancers and the genes they target that looks like this for mm10 genome:
     Enhancer                  Target Gene
  1:   chr4_98727908_98728497  L1td1
  2:   chr9_78623220_78624062  Cd109
  3:   chr9_78615332_78616035  Cd109
  4: chr2_146299937_146300524  Insm1
  5: chr2_146218029_146218779  Insm1
Using this list, I would like to make a plot like this, connecting each enhancer to its target gene(s):
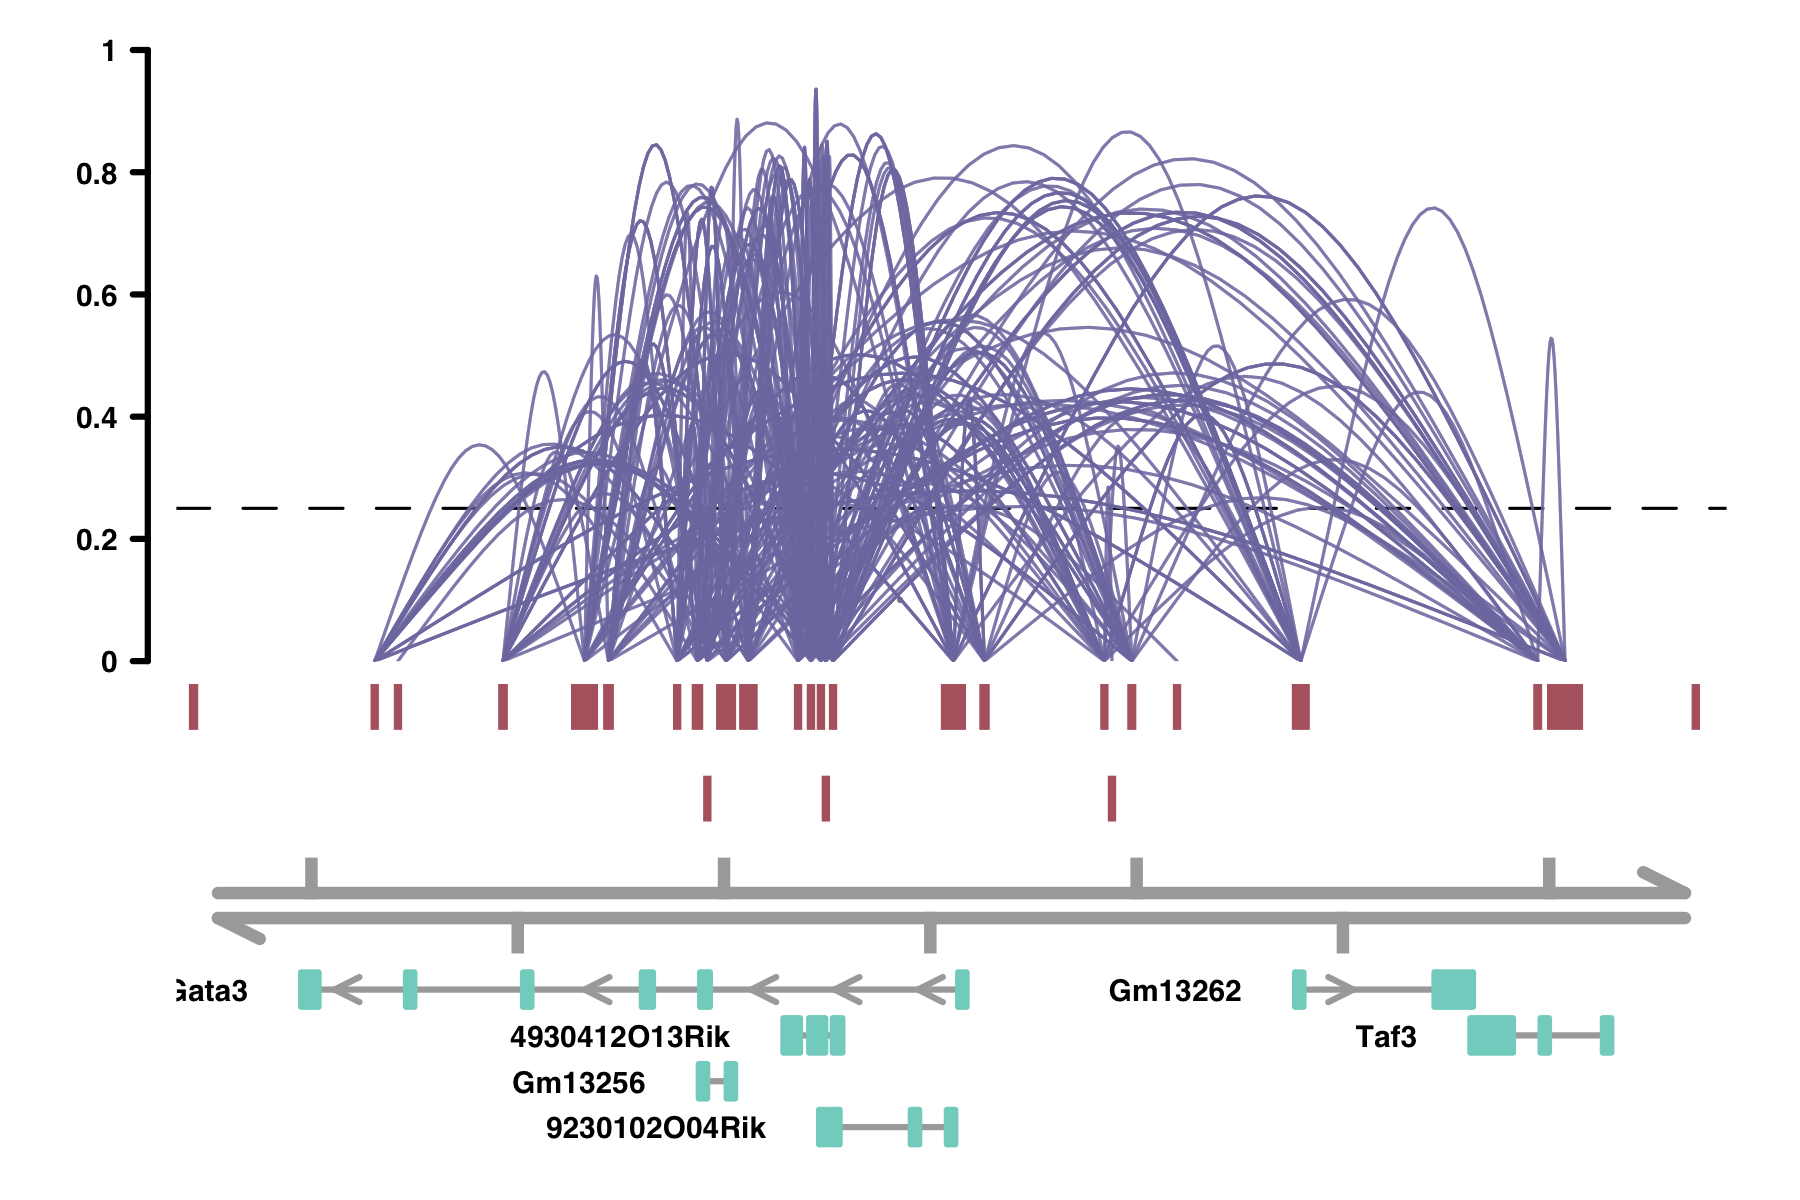
It looks like this is the function they used to make this graph: github.com/cole-trapnell-lab/cicero-release/blob/master/R/plotting.R
Is there a quick way to do this with an R package or IGV? I am not working with single cell data like Cicero is designed for.
• 681 views
•
link
0 answers
No answers yet.
Log in to answer this question.