Thank you so much!
• 0 views
•
link
Hey. I have bulk RNA-seq raw count data and metadata on hand.
The metadata have three independent variables: genotype (KO & WT), sex (F & M), and Rin (continuous).
I wanna see if KO vs. WT have significantly different gene expressions, when adjusting for sex and Rin.
I usedaov()andlm() in R to run the analysis, but got different p values for categorical independent variables, aka, genotype and sex. But for Rin (continuous variable), the p values are the same. I am wondering why that is. I also saw somewhere online that lm() and aov() can be considered identical, but why results are different from the two models. And more importantly, which p value should I trust and use?
Thanks!
Take one gene for example, my codes are here:
#anova

> ano<- aov(ENSMUSG00000051951~genotype+sex+rin, data = old.df)


> summary(ano)


Df Sum Sq Mean Sq F value Pr(>F)
genotype     1 0.1764  0.1764   1.517 0.2323


sex          1 0.7178  0.7178   6.174 0.0219 *


rin          1 0.4111  0.4111   3.536 0.0747 .

Residuals   20 2.3253  0.1163
---
Signif. codes:  0 ‘***’ 0.001 ‘**’ 0.01 ‘*’ 0.05 ‘.’ 0.1 ‘ ’ 1

#linear regression
> lmr<- lm(ENSMUSG00000051951~genotype+sex+rin, data = old.df)


> summary(lmr)


Call:
lm(formula = ENSMUSG00000051951 ~ genotype + sex + rin, data = old.df)


Residuals:
     Min       1Q   Median       3Q      Max
-0.81176 -0.19161  0.07608  0.27481  0.50259


Coefficients:
            Estimate Std. Error t value Pr(>|t|)

(Intercept)  -2.7457     3.5691  -0.769  0.45072

genotypeWT   -0.2575     0.1465  -1.757  0.09418 .

sexM         -0.5916     0.1909  -3.099  0.00566 **


rin           0.7371     0.3920   1.881  0.07468 .
---

Signif. codes:  0 ‘***’ 0.001 ‘**’ 0.01 ‘*’ 0.05 ‘.’ 0.1 ‘ ’ 1

Residual standard error: 0.341 on 20 degrees of freedom
Multiple R-squared:  0.3595,    Adjusted R-squared:  0.2635
F-statistic: 3.743 on 3 and 20 DF,  p-value: 0.02772
There are established methods for differential expression to do this. Please use limma, edgeR, DESeq2 or other established package.
Firstly - you say you have RNA "counts" yet you are using a straightforward linear model. At the very least for count data this should be a generalized linear model with a count link (poisson, quasi-poisson, negative binomial).
But beyond that, the dispersion for such a link function has a known dependence on mean expression: (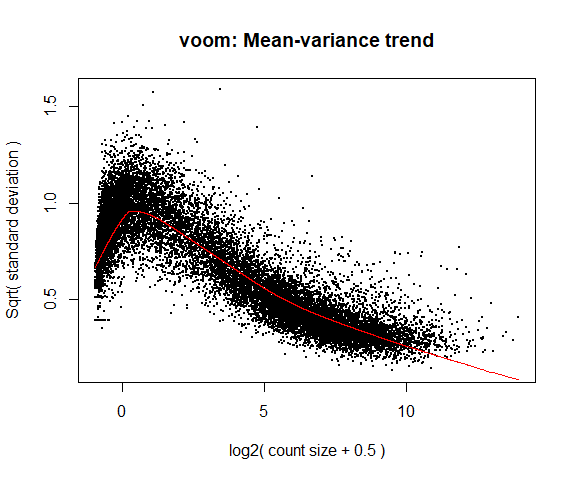 ) which in your case is left unmodeled:
So please don't re-invent the wheel, and use an established method for differential expression.
Thank you so much!
Log in to answer this question.
The text font seems terrible, but I do not know how to adjust them. Please bear with me.
Select text you want to format as
codeand then use the101010button in the editor. I have done it for you this time.Thanks a lot!! Seems so better now. Will do it going forward.
Thanks for enlightening me of the distribution of the rawcount data.
I am so sorry for not mentioning that I have normalized the rawcounts and now they are in log2RPKM form. I see some papers using ANOVA for DEG, so I would like to try that. But I am just confused if I should use ANOVA or linear regression.
Normalized counts on log2 scale are still overdispersed (what LChart is showing in the plot) and is not accounted by the methods you mention. I think LChart's answer nails the essential points: Don't reinvent the wheel, use specialized software that outperforms ANOVA and lm. Really, just put the raw counts into DESeq2 or others and be done with it.
Thank you! Got it.