First of all, Deeptools rocks and I love it and all it's developers.
I have a little issue with plotPCA where datapoints are stacked on PC1. This was previously observed in ChIPseq data Extract further information from deepTools plotPCA , deeptools PCA vs ChIPQC PCA
couldn't find a similar post for RNA-seq experiments.
Here are my test commands:
$ plotPCA -in RNA_multiBamSummary_over_NCBI_Refseq_bed12.npz -o test.png

$ plotPCA -in RNA_multiBamSummary_over_NCBI_Refseq_bed12.npz --transpose -o test_transpose.png

$ plotPCA -in RNA_multiBamSummary_over_NCBI_Refseq_bed12.npz --rowCenter -o test_rowCenter.png
which generate the plots:
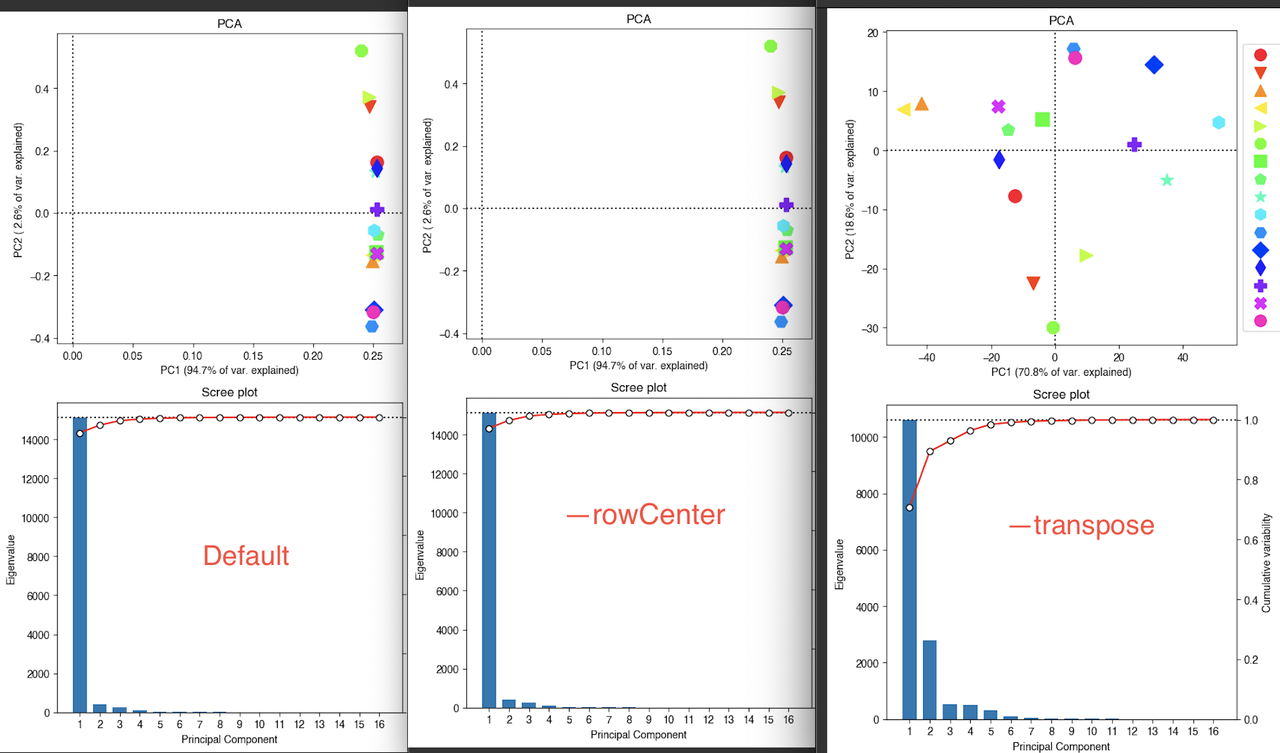
Should I simply transpose the data? I'd rather not as I dislike R logic where samples are rows and observations are columns. Plus, the results aren't really consistent with the biology.
I tried plotting PC2 vs PC3 without transposing and I get more relevant results - is that OK to do for an RNA-seq experiment?
This may be irrelevant, but my bed12 file contains transcript isoforms. Could this bias the PCA?
Here is the correlogram of the same data and matrix:
plotCorrelation --whatToPlot heatmap --corMethod pearson --corData RNA_multiBamSummary_over_NCBI_Refseq_bed12.npz -o test_correlogram.png --plotNumbers
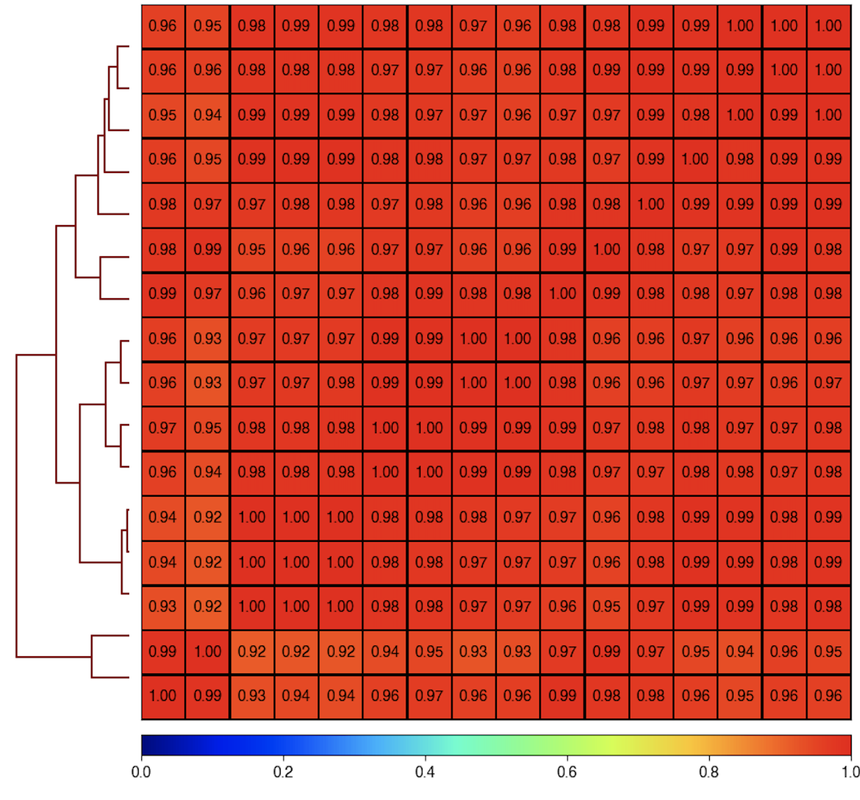
Since these data are so highly correlated, maybe it's screwing up something with PCA's ability to properly define a PC1?
Any help is greatly appreciated!
0 answers
No answers yet.
Log in to answer this question.