Entering edit mode

3.2 years ago
aminijavad4
▴
10
Hi
I plotted chord diagram by the circlize R package In accordance with its tutorial (https://jokergoo.github.io/circlize_book/book/advanced-usage-of-chorddiagram.html). But the plots are drawn incompletely.
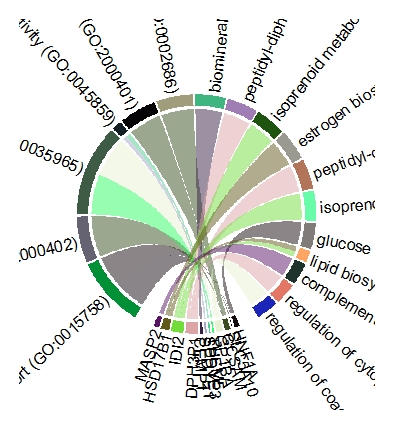
chordDiagram(day0)
chordDiagram(day0, annotationTrack = c("name", "grid"),
annotationTrackHeight = c(0.03, 0.01))
circos.track(track.index = 1, panel.fun = function(x, y) {
circos.text(CELL_META$xcenter, CELL_META$ylim[1], CELL_META$sector.index,
    facing = "clockwise", niceFacing = TRUE, adj = c(0, 0.5)) }, bg.border = NA)
The labels are not in the photo correctly and completely. I appreciate if anybody share his/her comment with me.
Thanks in advance.