Thanks, I've tried it before. Well it is not for multiple sequence alignments but to compare between two sequences. Or maybe I don't understand it well.
• 0 views
•
link
Hi all!
I need to compare aligned genomes and visualize it with dotplot. I have used Gepard and D-Genies but I don't see the possibility to add clusters IDs into the chart. Also, cause of the large alignment file it is almost impossible to add this information by myself in graphic program. I was looking for some kind of solution in R? Is there a package where I can do similar plots to those generated by Gepard?
Many thanks for any suggestions,
Best, Agata
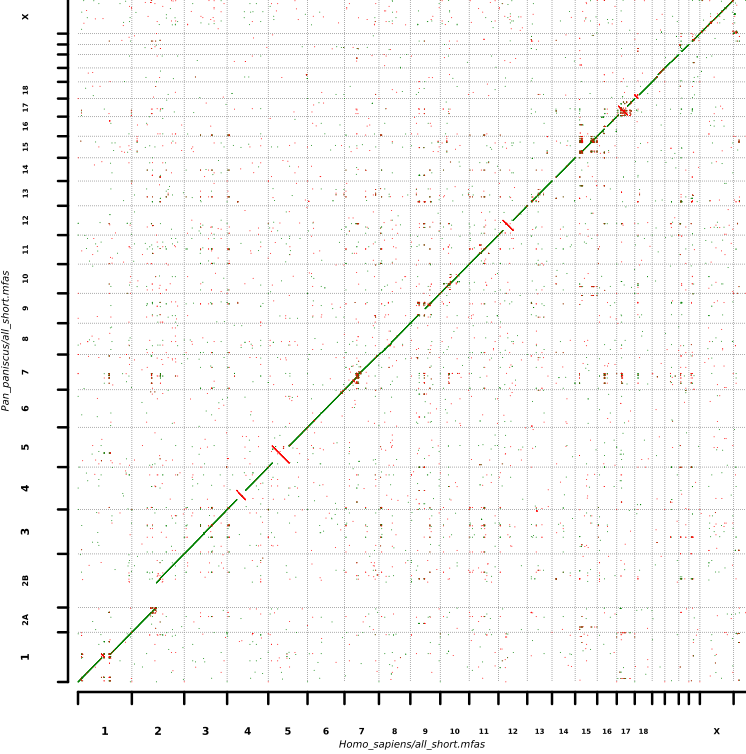 from the yass dna website
Thanks, I've tried it before. Well it is not for multiple sequence alignments but to compare between two sequences. Or maybe I don't understand it well.
Well, Gepard and D-genies are doing the work but charts output are illegible. What I need is to add clusters IDs into the charts like here: https://www.researchgate.net/figure/Cluster-relationships-are-evident-in-Gepard-dotplot-alignments-using-whole-genome_fig1_239946364
I thought that it will be possible to do with those programs but I didn't find an options. Adding info in graphic program is also very hard, cause my alignment is really large. I assumed that there must be some equivalent solution in R. R can produce such a great plots with proper custom labels etc. Unfortunately it has to be dotplot. To be honest I am really stuck in here.
Log in to answer this question.