Thanks Dunois for your valuable help.
• 0 views
•
link
I'm trying to draw a Sankey plot. But while plotting I'm getting some issues as some target and source nodes are missing and also the edges/links are not as same color as source node.
My Sankey Code:
library(tidyverse)
library(viridis)
library(patchwork)
library(hrbrthemes)
library(circlize)
library(networkD3)
library(readxl)

DF <- read.delim(file = "FOR_SANKEY.txt")
# Make a list of total number of
nodes <- data.frame(name=c(as.character(DF$source), as.character(DF$target)) %>% unique())
# Assign IDs to source and target
DF$IDsource=match(DF$source, nodes$name)-1
DF$IDtarget=match(DF$target, nodes$name)-1

# Assign color scale
ColourScal ='d3.scaleOrdinal(["#FF5733","#33DBFF","#FF8733","#FF9F33","#FFF033", "#DFFF33", "#FF3351", "#33FFE1", "#EB33FF", "#47FF33", "#9733FF", "#338CFF", "#6BFF33", "#C733FF", "#9D33FF", "#95FF33", "#33ECFF", "#FF4633", "#DAFF33", "#5833FF"])'
# Make the Network
sankeyNetwork(Links = DF, Nodes = nodes, Source = "IDsource", Target = "IDtarget", Value = "value", NodeID = "name",  sinksRight=FALSE, colourScale=ColourScal, nodeWidth=20, fontSize=12, iterations = 0)
My input Data:
source  target  value   IDsource    IDtarget
CEBPB   C3_ Bile acid   -0.389361351    0   20
E2F5    C3_ Bile acid   -0.395798119    3   20
FOXM1   C3_ Bile acid   -0.431892661    5   20
KLF11   C3_ Bile acid   -0.245382431    6   20
YBX1    C3_Fatty acid   0.352803344 12  21
RCOR2   C3_Glycolysis   0.234987627 10  22
E2F5    C3_Methionine   -0.372301522    3   23
FOXM1   C3_Methionine   -0.302098443    5   23
YBX1    C3_Methionine   -0.45913054 12  23
E2F2    C3_Purine   0.376737908 2   24
E2F5    C3_Purine   0.325288339 3   24
FOXM1   C3_Purine   0.48464042  5   24
E2F5    C3_Pyrimidine   0.230968129 3   25
FOXM1   C3_Pyrimidine   0.27487664  5   25
FOXA1   C4_Cyclic nucleotides   0.124340069 4   26
XBP1    C4_Cyclic nucleotides   0.165542857 11  26
ZBTB20  C4_Cyclic nucleotides   -0.308870128    13  26
XBP1    C4_Glycerophospholipid  0.166331418 11  27
ZBTB20  C4_Glycerophospholipid  -0.272486646    13  27
FOXA1   C4_Glycolysis   -0.328322849    4   28
FOXA1   C4_Nucleotide   0.220425799 4   29
XBP1    C4_Nucleotide   0.227317275 11  29
ZBTB20  C4_Nucleotide   -0.196174304    13  29
FOXA1   C4_Phosphoinositide     0.38027914  4   30
XBP1    C4_Phosphoinositide     0.174345152 11  30
ZBTB20  C4_Phosphoinositide     -0.115285479    13  30
POU2F1  C5_ GPI -0.659795918    9   31
ZMAT3   C5_Chondroitin sulfate degradation  -0.447244898    14  32
ZNF430  C5_Chondroitin sulfate degradation  -0.395714286    17  32
ZNF264  C5_Fatty acids oxidation peroxisomal    0.469450751 16  33
NFYB    C5_Glutathione  0.444143983 8   34
ZNF264  C5_Glutathione  0.381897498 16  34
ZNF69   C5_Glutathione  0.385724126 19  34
ZNF69   C5_Glyoxylate   -0.500625016    19  35
ZNF669  C5_GPI  -0.690306122    18  36
NFYB    C5_Keratan sulfate  -0.495918367    8   37
ZMAT3   C5_Keratan sulfate  -0.479285714    14  37
ZNF430  C5_Keratan sulfate  -0.482755102    17  37
ZNF669  C5_Lysine   -0.659795918    18  38
DRAP1   C5_Oxidative    -0.375886525    1   39
NFYB    C5_Oxidative    -0.458163265    8   39
POU2F1  C5_Oxidative    -0.636734694    9   39
ZMAT3   C5_Oxidative    -0.46622449 14  39
ZNF14   C5_Oxidative    -0.424081633    15  39
ZNF264  C5_Oxidative    -0.439489796    16  39
ZNF430  C5_Oxidative    -0.39   17  39
ZNF669  C5_Oxidative    -0.614489796    18  39
ZNF69   C5_Oxidative    -0.392040816    19  39
ZNF669  C5_Pterin   -0.543534274    18  40
KLF4    C6_Arginine and proline -0.537148898    7   41
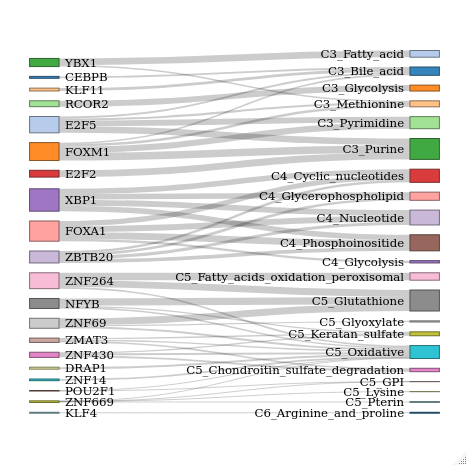
The reason why you're getting "incomplete" plots is because your data contains negative values (e.g., DF$value[1] is -0.3893614). It appears sankeyNetwork() cannot handle negative values for the Value variable that indicates the distance between the nodes/flux. The easiest workaround might be to just add the absolute value of the smallest DF$value to all DF$value like so DF$value <- DF$value + abs(min(DF$value)) to eliminate negative values. Plotting this remedied data yields this:
You can also run this command.
sankeyNetwork(Links = DF, Nodes = nodes, Source = "IDsource",
              Target = "IDtarget", Value = "value", NodeID = "name",
              sinksRight=FALSE, LinkGroup = "target", colourScale = JS(

                'd3.scaleOrdinal()
    .domain(["Solar","Nuclear","Hydro","Wind","Geothermal","Natural Gas","Coal","Biomass","Petroleum","Electricity","Residential","Commericial","Industrial","Transportation","Rejected Energy","Exports","Energy Services"])
    .range(["#FFFF00","#FF0000","#0000FF","#800080","#A52A2A","#00FFFF","#000000","#00FF00","#008000","#FFA500","#FAAFBE","#FAAFBE","#FAAFBE","#FAAFBE","#C0C0C0","#FFA500","#808080"])'

              ),
              fontSize = 12, nodeWidth = 20, iterations = 0)
Log in to answer this question.
