Hi!
I have a question about the G matrix that I'm sure some of you guys will be able to answer.
I have two Populations, pop1 (700 ind) and pop2 (100 ind).
pop1 and pop2 are suposedly genetic related
Here are three heatmaps for the realized relationship matrix
Pop1: 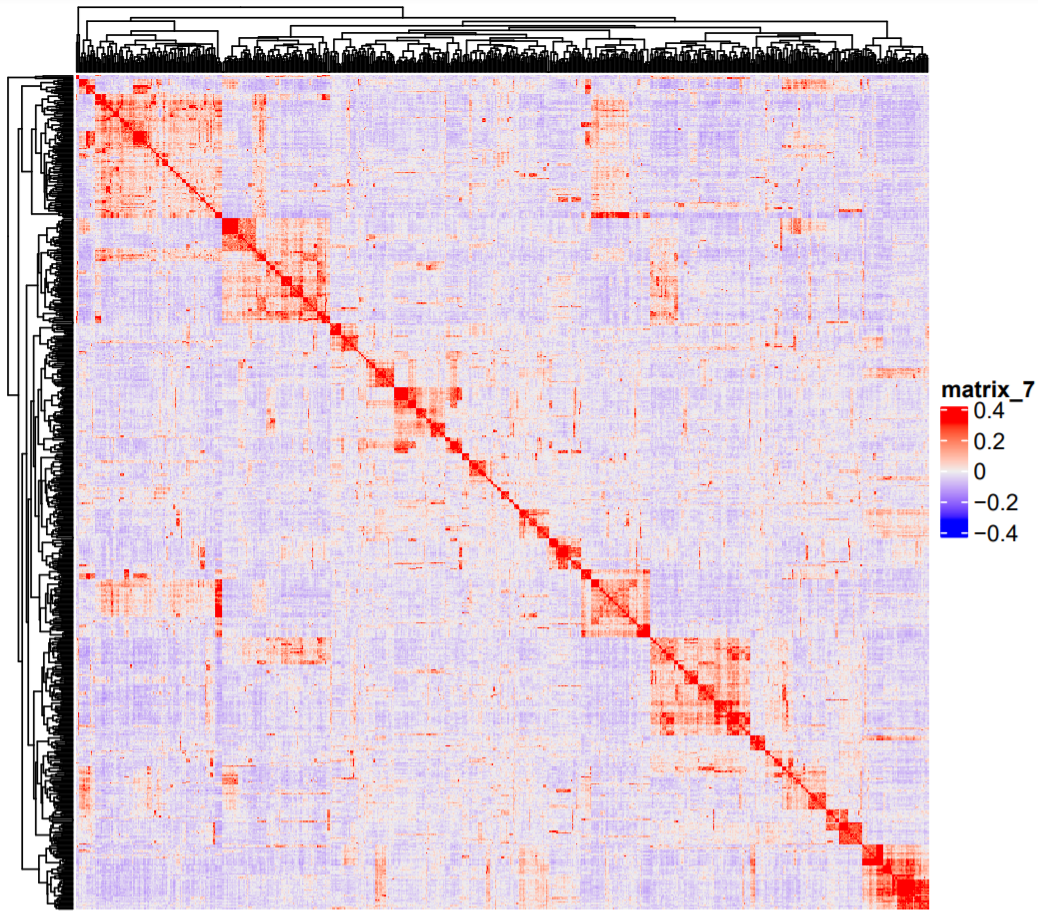
Pop2: 
And the last one, built after joining the SNP data for both
Pop1_2: 
The small red square at the right bottom is Pop2, which clustered all toghether because the relatedness values strongly increase after joining both SNP datasets.
My question is: Why is this happening? Pop2 presented pairwise relatedness values that appeared to be ok in the first heatmap, but when joined with Pop1, a population that it should be genetically related, the pariwise relatedness values harshly increase.
The mean of the main diagonal for Pop2 alone is 0.80, but when joined with Pop1 it becomes 1.59. The pairwise relatedness also increase a lot, as you guys can see.
Am I missing something important about VanRaden's G properties?
Thanks in advance!
0 answers
No answers yet.
Log in to answer this question.