Entering edit mode

3.6 years ago
ccha97
▴
60
Hello, I am wanting to create a similar heatmap (using kmeans clustering rather than hierarchical) to this figure, which is extracted from Figure 2 from Scharer et al. (2017) 'Cutting Edge: Chromatin Accessibility Programs CD8 T cell Memory'.

I've done my DGE analysis using DESeq2, and am just wondering the best way to go about with the GO-term analysis + heatmap. On another note - how many genes would one recommend for clustering? I have taken the top 100 variable genes, where my biggest cluster is 65 genes - yet when I try run clusterProfiler, it outputs "No gene set have size > 10 ... --> return NULL..."
Do you mean how many genes you should use for input to clusterProfiler? For GO enrichment analysis you generally pick a Log2 fold change and adjusted p-value threshold, and then run GO on all genes (split into up an down regulated) that pass the thresholds. |Log2FC| > 1 and padj < 0.05 are fairly common thresholds,
To make your life easier use their formula interface to do the analysis. The input should be a dataframe that has a column with DEGs, a column for upregulated vs downregulated, and another column for sample. Since that figure uses p-values, you want to set the p-value cutoff to be 1, since you want the p-value for all terms tested for each sample.
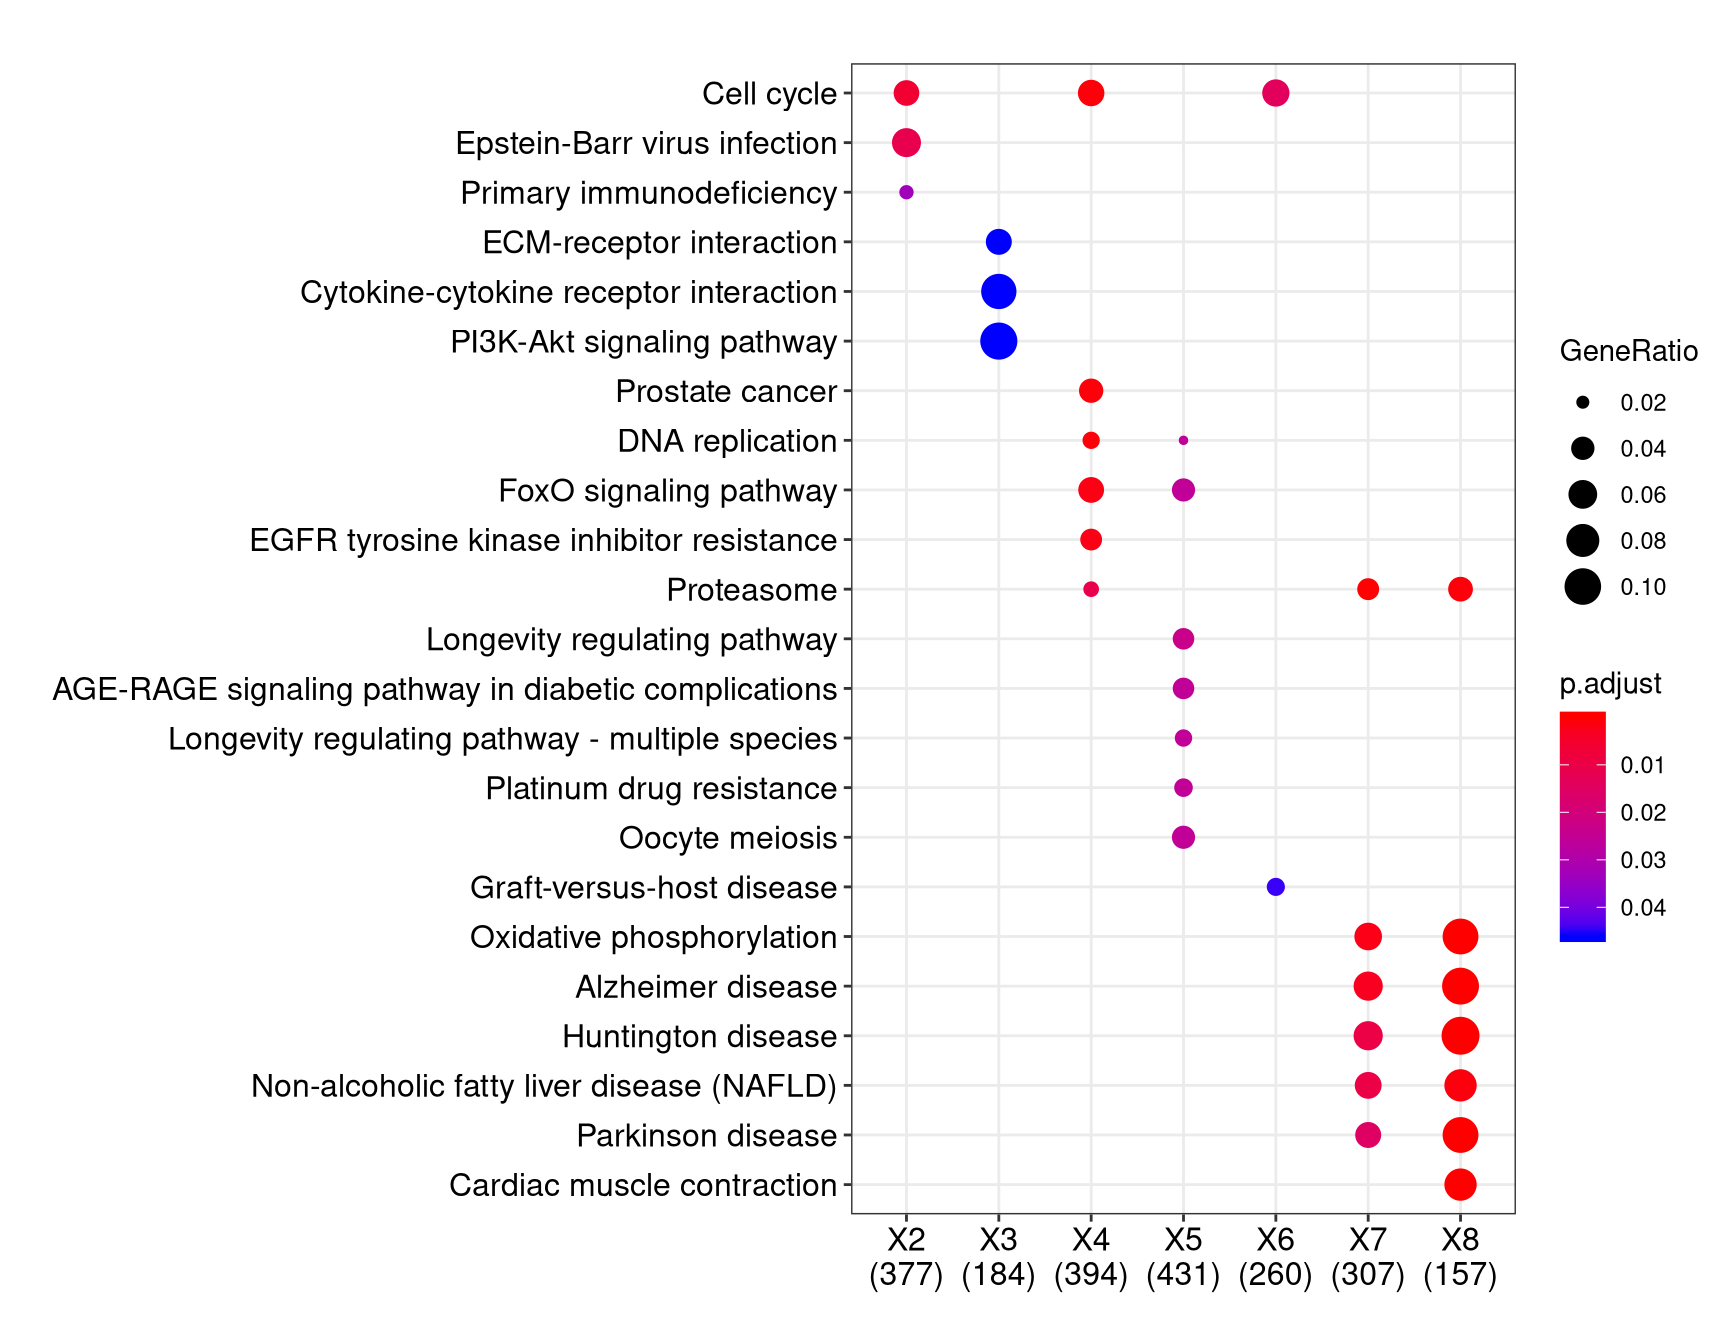
For whichever result you want to make a heatmap of, create a matrix with rows as GO terms (in the paper they use the top 5 go terms per module), columns as modules/samples, and values would the adjusted p-values for each term. You can then make a k-means clustered heatmap using ComplexHeatmap. Read the section on clustering in their vignette here. If you are having difficulty with this step update your question with a minimal reproducible example and someone can walk you through it.
Thank you for your answer, their formula interface/compareCluster is exactly the sort of function I'm looking for. I'm still having trouble understanding the input required, particularly for the downregulated/upregulated columns - will I still need to do this for to get the same output as below?
They use the input gcSample, but I'm still not sure what the original df/input should look like. They say a named list of gene IDs, so for clarification - for the top row, it'd be the cluster number and for each column down would be the genes in that cluster?
To make the plot you linked to, you start with a data.frame that has 3 columns: gene, sample, and then whether it was up or downregulated for that sample. This is used as input to their formula interface using
gene ~ sample + de_status(or whatever you end up calling the column names).