thanks a lot. If i want not to show the condition inside the boxes. how do i do that?
• 0 views
•
link
hi all, trying to create a stacked barchart. But i dont understand why the "blocks" have different sizes for each category (A, B, C) and why the y axis labels are only 3 and low down.
p<-ggplot(data = example, aes(x=type, y=condition, fill=value))
p + geom_bar(stat = "identity", width = 0.6, color = "black",size = 0.5,alpha = 0.7) +
  theme_minimal() + theme(legend.position = "right", axis.text.x = element_text(angle = 45, hjust = 0.8)) +
  labs(x= "type", y = "condition", title = "Gest",caption = "spiros")+
  scale_x_discrete(limits = c("A", "B","C")) +
  geom_text(aes(label = condition), position = position_stack(vjust = 0.5), size = 3)
data i used :
type    value   condition
A   0   wt
A   0   wt
A   0   wt
A   0   wt
A   0   wt
A   0   wt
A   0   wt
A   0   wt
A   0   wt
A   0   wt
A   0   wt
B   1   hela
B   1   hela
B   1   hela
B   1   hela
B   1   hela
B   1   hela
B   1   hela
B   1   hela
C   1   namalwa
C   1   namalwa
C   1   namalwa
C   1   namalwa
C   1   namalwa
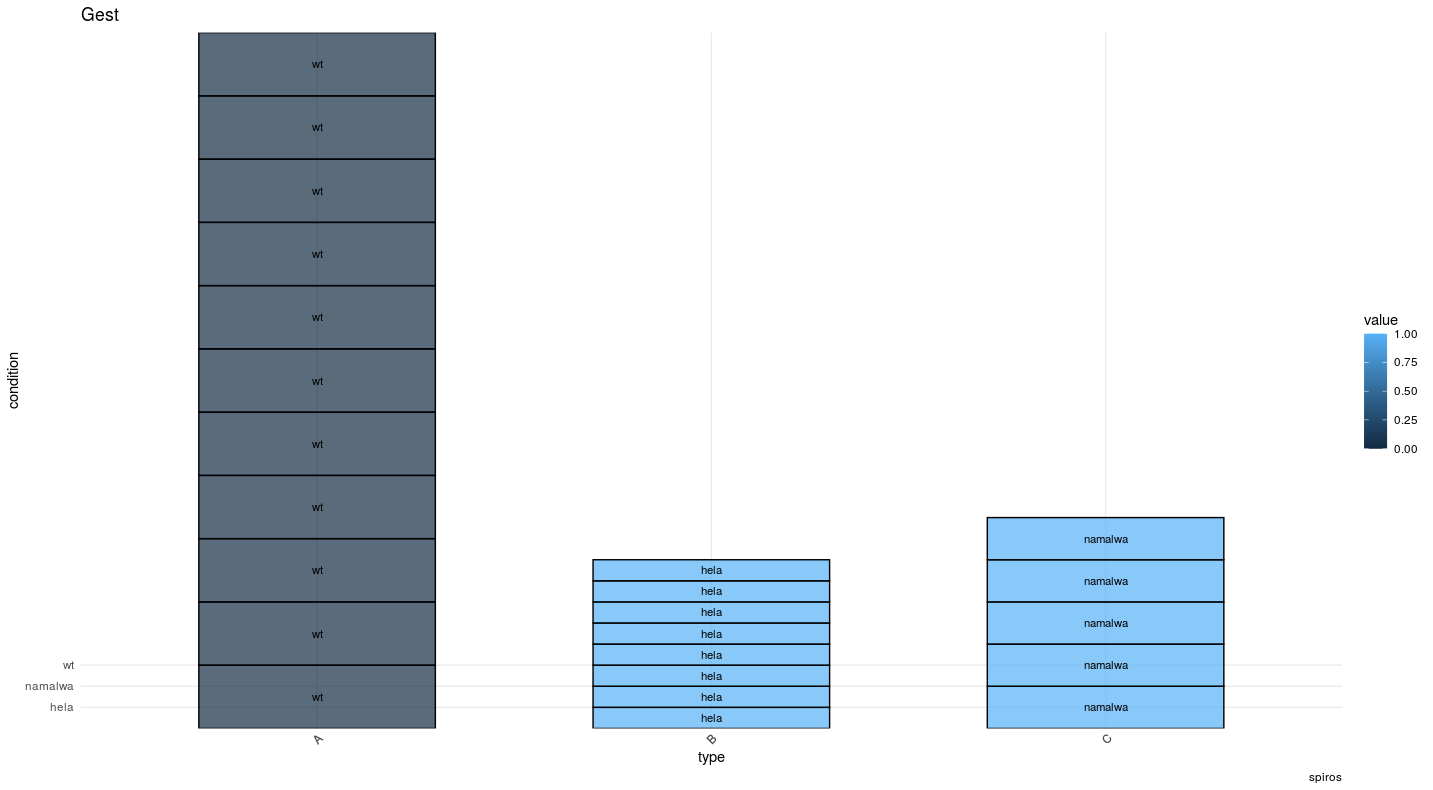
https://freeimage.host/i/2JU6gV
Hi,
so if you just want to make the boxes the same size, you can do this:
example$box_size <- 1
p<-ggplot(data = example, aes(x=type, y=box_size, fill=value))
p + geom_bar(stat = "identity", width = 0.6, color = "black",size = 0.5,alpha = 0.7) +
  theme_minimal() + theme(legend.position = "right", axis.text.x = element_text(angle = 45, hjust = 0.8)) +
  labs(x= "type", y = "", title = "Test",caption = "spiros")+
  scale_x_discrete(limits = c("A", "B","C")) + scale_y_discrete(limits = c("wt", "hela","namalwa"))+
  geom_text(aes(label = condition), position = position_stack(vjust = 0.5), size = 3)
Or alternatively, if if you don't want this y axis tags and your value parameter is discrete:
example$box_size <- 1
example$value <- as.factor(example$value)
p<-ggplot(data = example, aes(x=type, y=box_size, fill=value))
p + geom_bar(stat = "identity", width = 0.6, color = "black",size = 0.5,alpha = 0.7) +
  theme_minimal() + theme(legend.position = "right", axis.text.x = element_text(angle = 45, hjust = 0.8)) +
  labs(x= "type", y = "", title = "Test",caption = "spiros")+
  scale_x_discrete(limits = c("A", "B","C"),breaks = c("A", "B","C")) + scale_y_discrete(limits = c(""),breaks = NULL)+
  geom_text(aes(label = condition), position = position_stack(vjust = 0.5), size = 3)
For future questions it would be easier to include a short code snipplet to create the example data, for example like so:
example <- data.frame(type=c(rep("A",11),rep("B",8),rep("C",5)), value=c(rep(0,11), rep(1,13)), condition= c(rep("wt",11), rep("hela",8), rep("namalwa",5)))
thanks a lot. If i want not to show the condition inside the boxes. how do i do that?
The conditions were added to the boxes with the last line geom_text(aes(label = condition), position = position_stack(vjust = 0.5), size = 3), so you would have to remove that line and the last "+" from the code.
If you'll use ggplot2 more often you should check out the meaning of the different commands for next time. Here is a nice cheatsheet
last 2 questions i hope... 1)how can i sort the columns depending on the number of entries, for example from left to right the number of entries increases and 2) is there a way to remove the gap between the columns ?
thanks a million!!!
you are welcome. For the second question I had to quickly google. For many R questions there is already someone else, who had the same problem in the internet ;)
this should do it:
Counting boxis per type with the tapply function and sorting the resulting named vector by number of boxes. The space between boxes can be removed by the "width" parameter in geom_bar.
#Create example data
example <- data.frame(type=c(rep("A",11),rep("B",8),rep("C",5)), value=c(rep(0,11), rep(1,13)), condition= c(rep("wt",11), rep("hela",8), rep("namalwa",5)))

#Define box size
example$box_size <- 1

#Define variable "value" as a factor (if it is discrete and if it makes sense)
example$value <- as.factor(example$value)

#counting entries (boxes?) per "type"
count_it <- tapply(example$box_size, example$type, sum)

#sort the named vector by its values for insertion on parameter "scale_x_discrete"
count_it <- count_it[order(count_it, decreasing = F)]

#Create the ggplot
p<-ggplot(data = example, aes(x=type, y=box_size, fill=value))
p + geom_bar(stat = "identity", width = 1, color = "black",size = 0.5,alpha = 0.7) +
  theme_minimal() + theme(legend.position = "right", axis.text.x = element_text(angle = 45, hjust = 0.8)) +
  labs(x= "type", y = "", title = "Test")+
  scale_x_discrete(limits = names(count_it) ,breaks = names(count_it)) + scale_y_discrete(limits = c(""),breaks = NULL)
Thanks thanks!! Now i am trying to do that increasing thing to data with many entries, and the way above isnt suited i think, because i have to count how many entries there are etc etc. Is there a way to do that automatically ?
Log in to answer this question.
What are you imaging the final plot to look like? Right now it's not clear how you want value to be represented in your plot.
Like the one i uploaded but with same "block" sizes. I dont understand why the sizes of these "blocks" change randonmly (or not - i dont know) and how i can make them all the same size.