Add Both Legends to a Plot
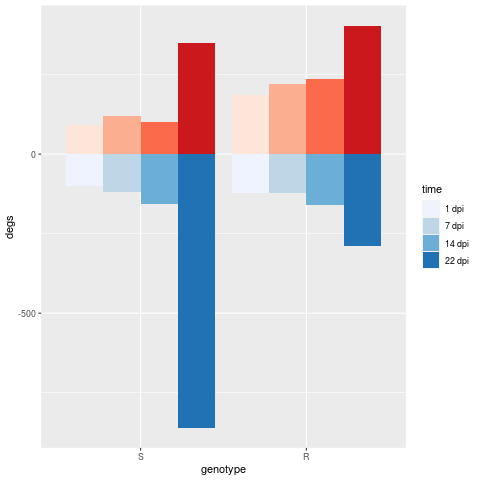
I have a plot that I have made counting the number of genes over a period of time in two samples. I would like to plot both sets of numbers in a waterfall chart. I am able to get the chart but I have difficulty getting both legends to show up. I have the following tables:
deg.up
genotype   time degs
1         S  1 dpi   91
2         S  7 dpi  121
3         S 14 dpi  102
4         S 22 dpi  349
9         R  1 dpi  186
10        R  7 dpi  220
11        R 14 dpi  236
12        R 22 dpi  404

deg.dn
 genotype   time degs
5         S  1 dpi  -99
6         S  7 dpi -120
7         S 14 dpi -157
8         S 22 dpi -860
13        R  1 dpi -121
14        R  7 dpi -122
15        R 14 dpi -161
16        R 22 dpi -288
I am using the following code to make the plot:
deg.dn$degs=deg.dn$degs*-1
deg.up$time=as.character(deg.up$time)
deg.dn$time=as.character(deg.dn$time)
deg.up$time = factor(deg.up$time, levels=unique(deg.up$time))
deg.dn$time = factor(deg.dn$time, levels=unique(deg.dn$time))
deg.up$genotype=as.character(deg.up$genotype)
deg.dn$genotype=as.character(deg.dn$genotype)
deg.dn$genotype = factor(deg.dn$genotype, levels=unique(deg.dn$genotype))
deg.up$genotype = factor(deg.up$genotype, levels=unique(deg.up$genotype))
breaksup = levels(deg.up$time)
breaksdn = levels(deg.dn$time)
brewup = c("#FEE5D9", "#FCAE91", "#FB6A4A", "#CB181D")
brewdn = c("#EFF3FF", "#BDD7E7", "#6BAED6", "#2171B5")

ggplot() +
  geom_bar(data = deg.up, aes(x=genotype, y=degs, fill=time), stat="identity", position="dodge") +
  scale_fill_manual(values=brewup, breaks=breaksup) +
  new_scale_fill() +
  geom_bar(data = deg.dn, aes(x=genotype, y=degs, fill=time), stat="identity", position="dodge") +
  scale_fill_manual(values=brewdn, breaks=breaksdn)
Would anybody be able to help me get both legends next to each other in the final plot? Thank you.!
• 1,100 views
•
link
1 answer
Hi,
If you want to keep your code as it is just add the parameter name to scale_fill_manual(), like this:
ggplot() +
    geom_bar(data = deg.up, aes(x=genotype, y=degs, fill=time), stat="identity", position="dodge") +
    scale_fill_manual(values=brewup, breaks=breaksup, name = "up") +
    ggnewscale::new_scale_fill() +
    geom_bar(data = deg.dn, aes(x=genotype, y=degs, fill=time), stat="identity", position="dodge",
             legend) +
    scale_fill_manual(values=brewdn, breaks=breaksdn, name = "down")
I hope this answers your question,
António
• 0 views
•
link
Log in to answer this question.