looks great, thanks!
• 0 views
•
link
Hi,
I uploaded peaks into the UCSC genome browser and I can see all of the peaks on the full chromosome. Now I'd like to draw the entire genome, with each chromosome showing the peaks throughout to get a good visual idea of the peaks distribution on the chromosomes. I am looking fir a tool that does this, has anyone any ideas? I assume there must be an option in R to do this.
My peaks are in bed format.
I am not very proficient in R, so any help would be greatly appreciated.
You can also give karyoploteR a try.
It has functions to plot peaks, reads densities and many other either in a whole genome view, in a subset of chromosomes or in a local region view.
There's a karyoploteR tutorial page with examples of this kind of plots. For example:
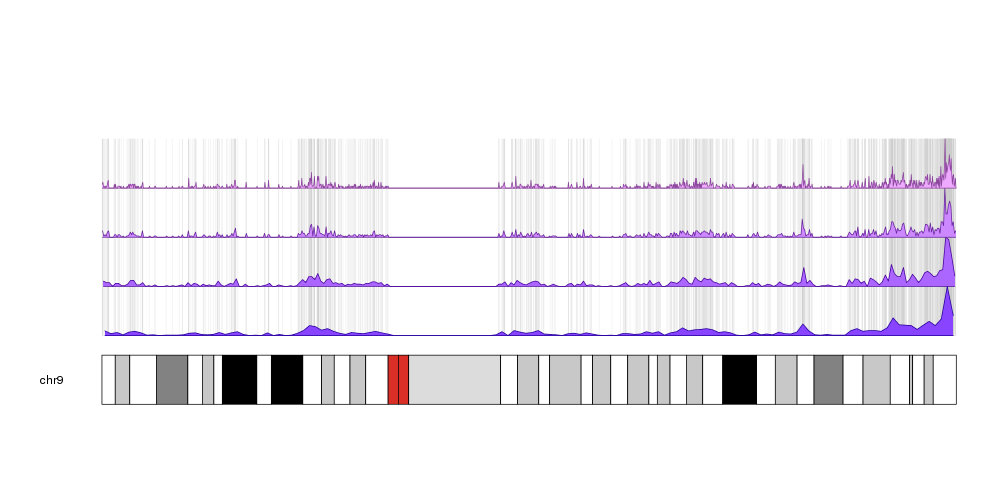
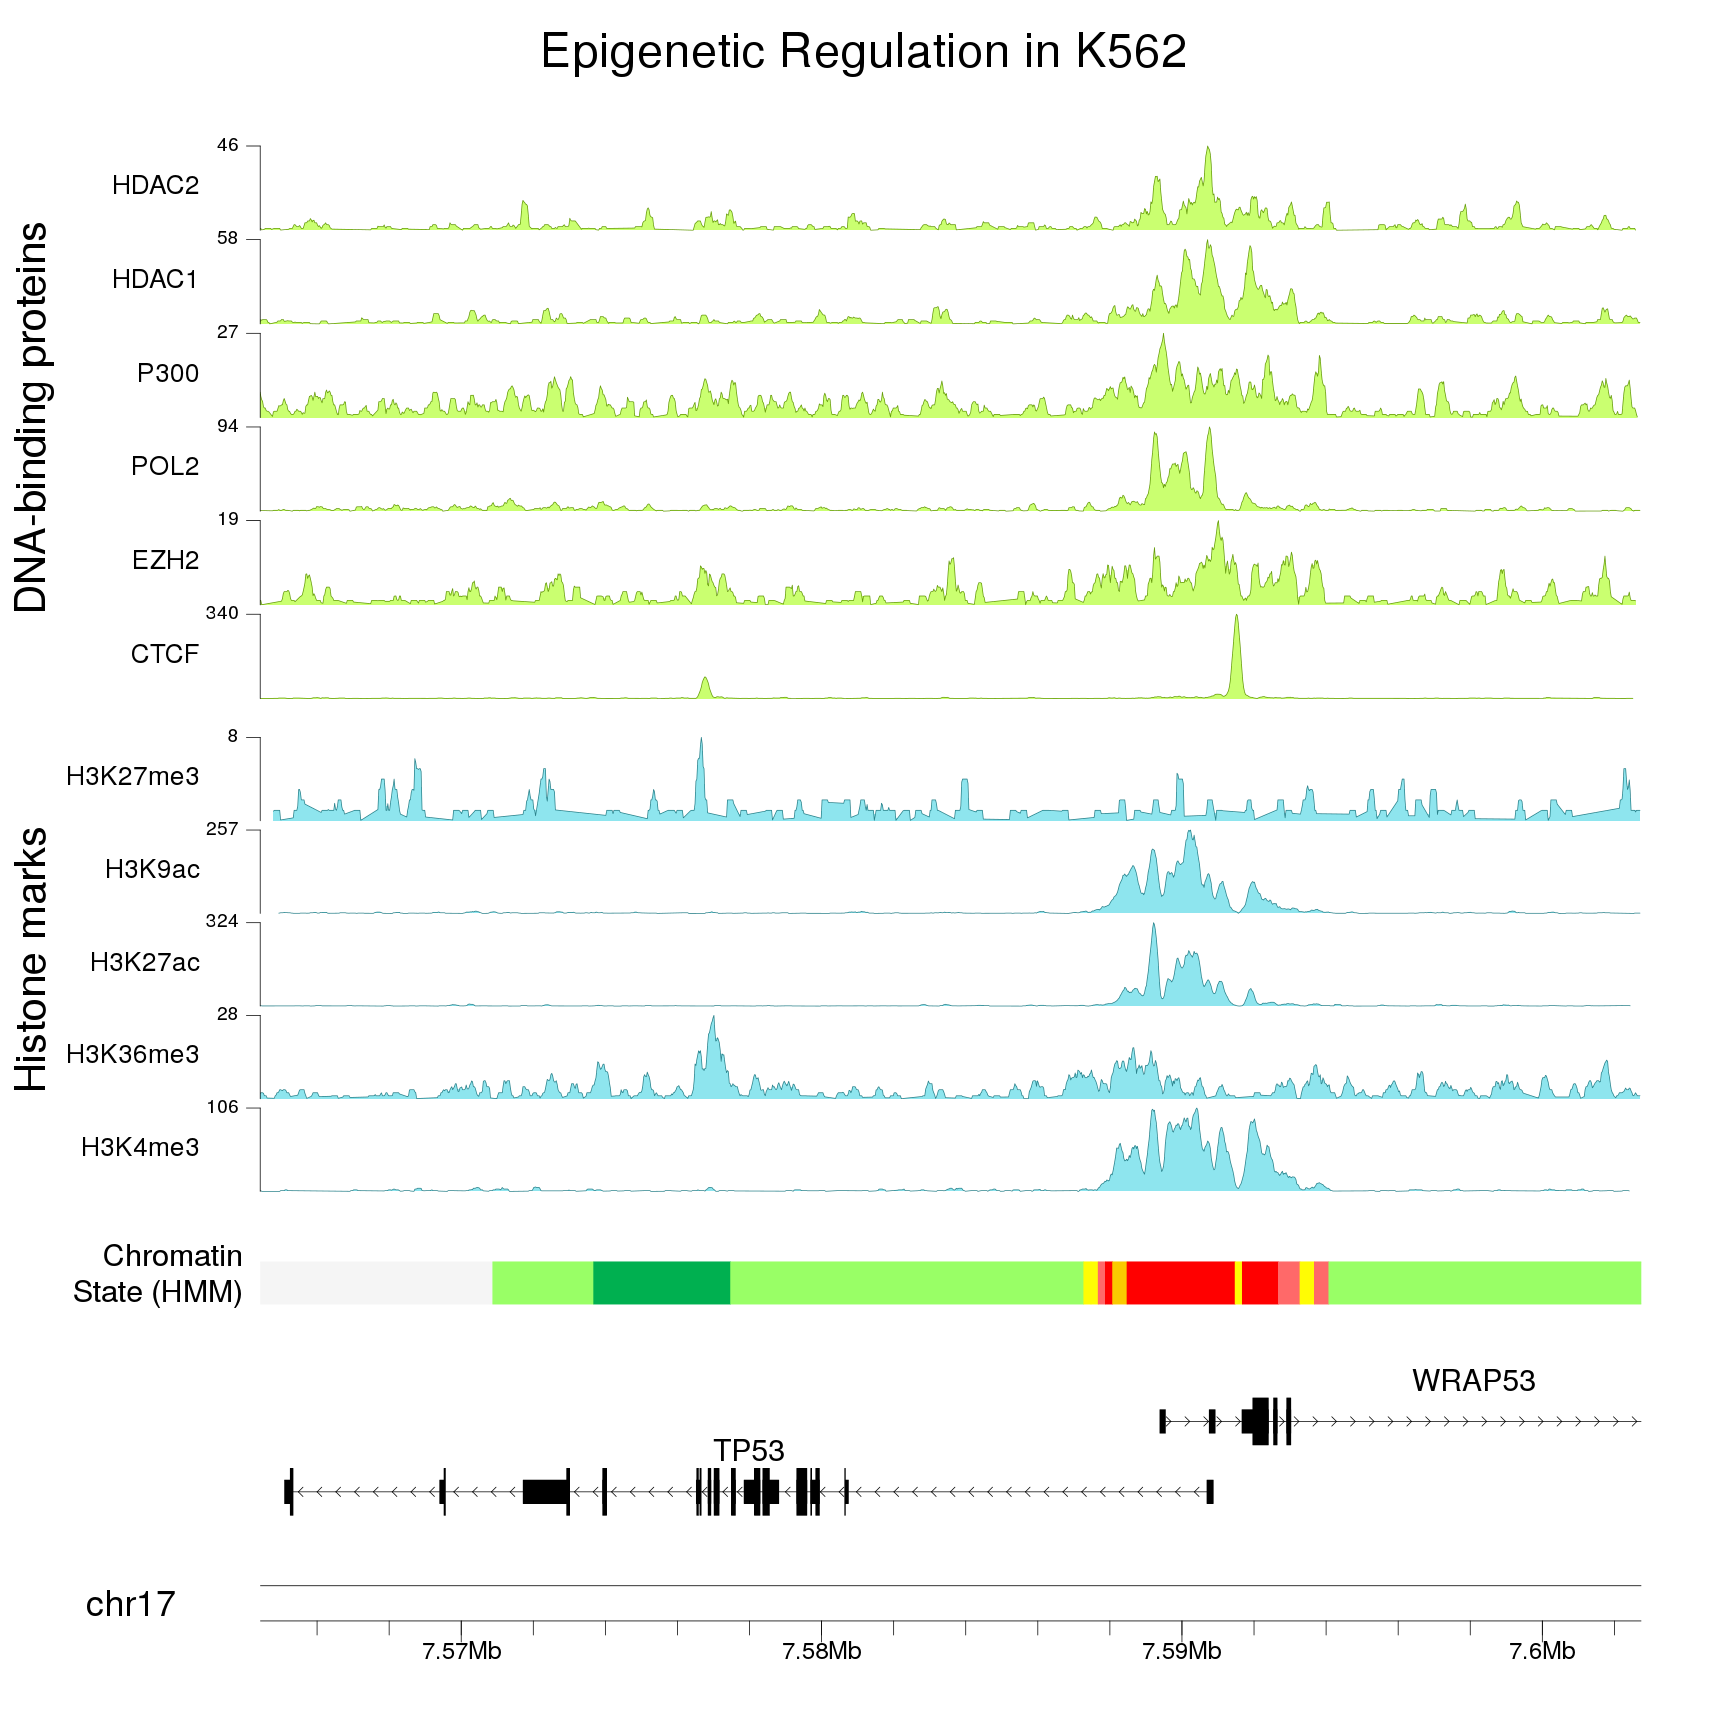
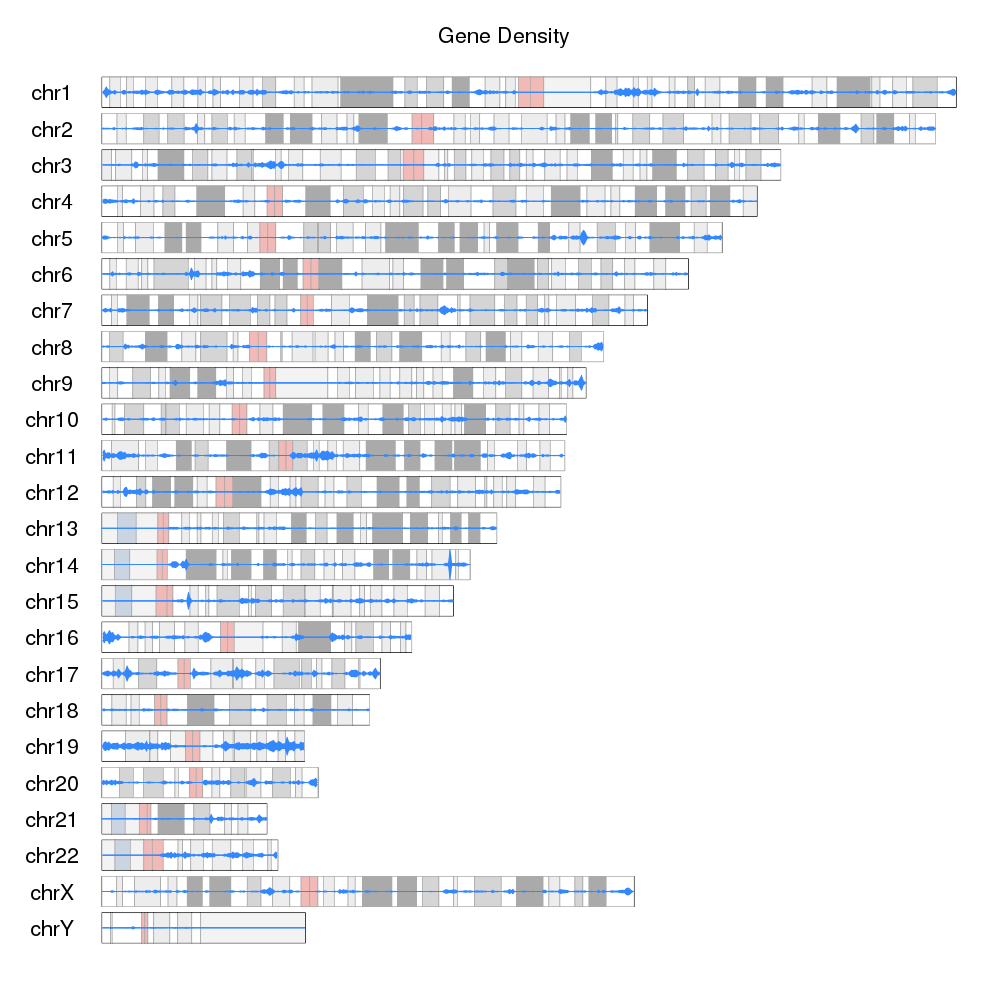
ChIPseeker has a simple function to do this (covplot).
looks great, thanks!
Log in to answer this question.