R heatmap() visualization -> expression values were not shown
Hello everyone,
I have problem with visualizing data with R heatmap()
Here is the input file:
test <- read.table("test.txt", header=TRUE)
head(test)
#       mir503_2 mir503_3   mir542_3 mir542_4 mir450a_1     log2fc
#Amer2        NA       NA         NA       NA        NA -1.7838786
#Wisp1        NA       NA         NA       NA        NA -1.6112954
#Fzd6         NA       NA         NA       NA        NA -1.3792360
#Ccnd1 -1.226608       NA         NA       NA        NA -1.2266078
#Fzd3         NA       NA -0.8968408       NA        NA -0.8968408
#Fzd5         NA       NA         NA       NA        NA -0.8275608
Then i ordered by log2fc
test_order <- test[order(test$log2fc),]

rownames(test_order)

[1] "Amer2"   "Wisp1"   "Fzd6"    "Ccnd1"   "Fzd3"    "Fzd5"    "Sfrp1"   "Nxn"     "Wnt4"
Then I picked specific columns:
test_selected_columns<- test_order[,1:6]
test_selected_columns <- as.matrix(test_selected_columns)
Now lets plot
library("RColorBrewer")

col<- colorRampPalette(c("red", "violet", "blue"))(256)

heatmap(test_selected_columns, Rowv=NA, Colv=NA, col = col,
                                              #xlab="something",
                                              ylab="",na.rm = TRUE,
                                              main="title",scale="column", margins=c(5,10))
But I got this plot!
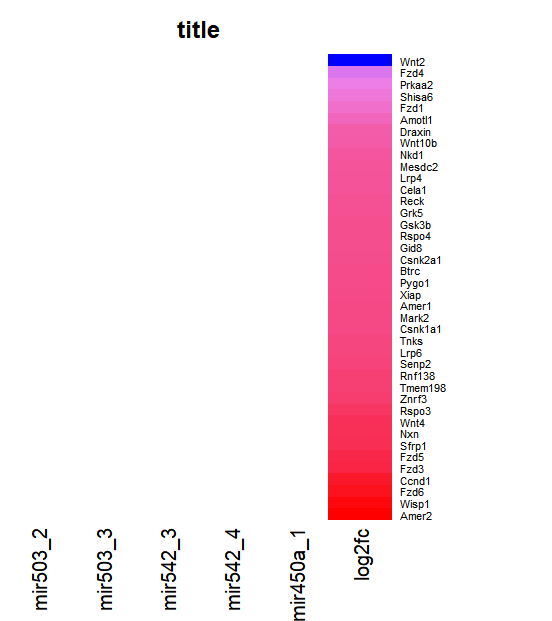
How can fix this issue? I used as.matrix() but it doesn't work?
Thank you
• 147 views
•
link
0 answers
No answers yet.
Log in to answer this question.
There is no "issue" to fix. Heatmap's working fine - it's showing the data you have. In all probability, all non-log2 columns in your 6-column matrix are full of
NAs, which is why you're seeing just white.na.rmcan't throw out entire columns, I guess.