how i can make genetic marker frequency plot?
how I can create one plot using this data for more than one chromosome?
1. CHR  Marker_ID   A   B   FRECUENCY_A FRECUENCY_B
 2.  1              0                  120  163 0.424028269 0.575971731
 3.  1        28511        138  179 0.43533123  0.56466877
 4.  1        80849        132  184 0.417721519 0.582278481
 5.  1        131493           134  188 0.416149068 0.583850932
 6.  2        174364             134    167 0.445182724 0.554817276
 7.  2             227341          140  174 0.445859873 0.554140127
 8.  2         489290          125  154 0.448028674 0.551971326
 9.   2        519811          141  166 0.459283388 0.540716612
 10. 2            546093           141  169 0.45483871  0.54516129
 11. 5           0                 111  165 0.402173913 0.597826087
 12. 5          10574371    128 186 0.407643312 0.592356688
 13. 5          24590938    110 162 0.404411765 0.595588235
 14. 5          25139346    117 169 0.409090909 0.590909091
 15. 5          25453449    118 174 0.404109589 0.595890411
• 1,170 views
•
link
1 answer
Hi
If you are trying to plot the frequencies (FRECUENCY_A and FRECUENCY_B) along the genome, take a look at karyoploteR. With kpPoints you should be able to plot your frequencies and get something like this
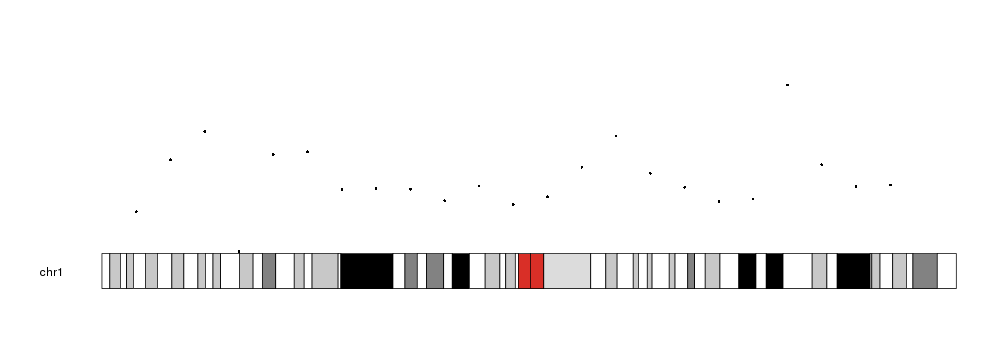
It takes care of the multiple chromosomes and you can plot one on top of the other or all in a single line. In any case, if you'd like to plot them in a different way you can refer to the karyoploteR tutorial or just ask here :)
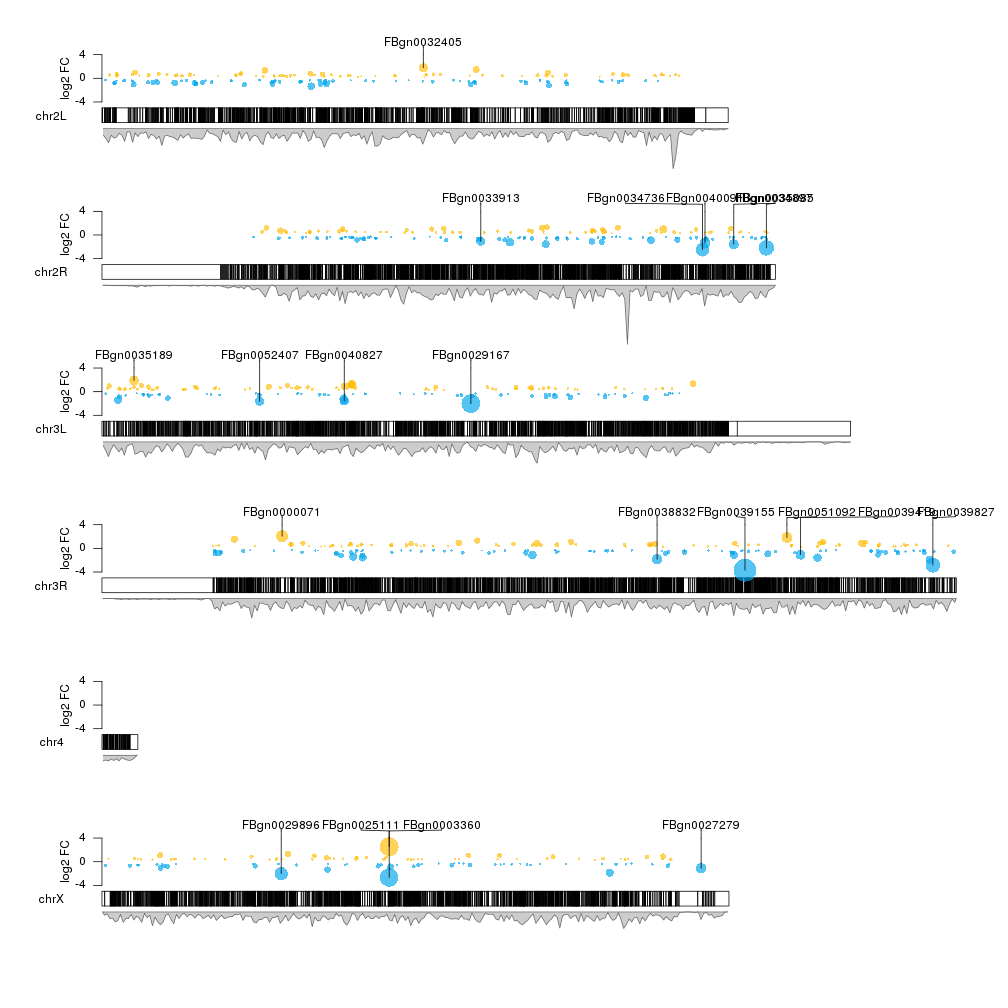
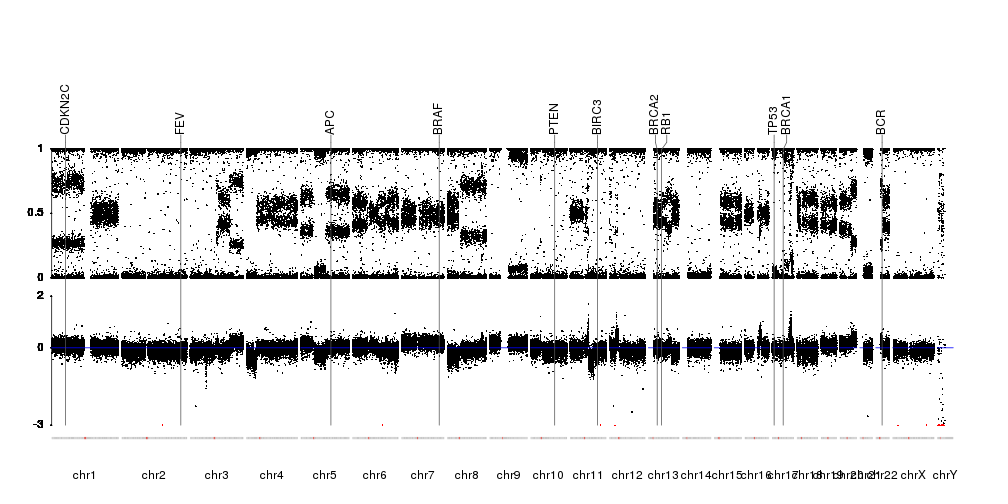
A couple of examples of other uses of kpPoints
• 0 views
•
link
Log in to answer this question.
Can you please link us to an example of a 'genetic marker frequency plot' ?