Hello, I have a plenty of scaffold and contig names which are non-numeric like Scaffold1 (or any other name. That's why I cannot replace them with number since I have names like Fvb1 etc) instead of "1".
So, can somebody offer a package in R to get Manhattan plots with non-numeric chromosome identifiers? Also, the x axis should be adjustable and not limited to fixed chr number.
Thanks!
3 answers
Solved. I used this GGplot2 Manhattan Plot Function. Thanks to authors!
We can cheat a little and make your chroms numeric, then use custom chrom labels, see this example:
library(qqman)

#example data from the package where CHR is numeric
table(gwasResults$CHR)
#    1    2    3    4    5    6    7    8    9   10   11   12   13   14   15   16   17   18   19   20   21   22
# 1500 1191 1040  945  877  825  784  750  721  696  674  655  638  622  608  595  583  572  562  553  544  535

# let's make ours character
x <- gwasResults
x$CHR <- paste0("chr", x$CHR)
table(x$CHR)
# chr1 chr10 chr11 chr12 chr13 chr14 chr15 chr16 chr17 chr18 chr19  chr2 chr20 chr21 chr22  chr3  chr4  chr5  chr6  chr7  chr8  chr9
# 1500   696   674   655   638   622   608   595   583   572   562  1191   553   544   535  1040   945   877   825   784   750   721

# as expected, this works!
manhattan(gwasResults)

# this doesn't work as we need numeric
manhattan(x)
# Error in manhattan(x) :
#   CHR column should be numeric. Do you have 'X', 'Y', 'MT', etc? If so change to numbers and try again.
A quick fix:
# assuming data is sorted by "CHR, BP", make CHR factor then numeric
mylabs <- unique(x$CHR) # we need this to preserve the order, otherwise it will order alphabetically
x$CHR <- as.numeric(factor(x$CHR, levels = mylabs))

# then use custom labels
manhattan(x, chrlabs = mylabs)
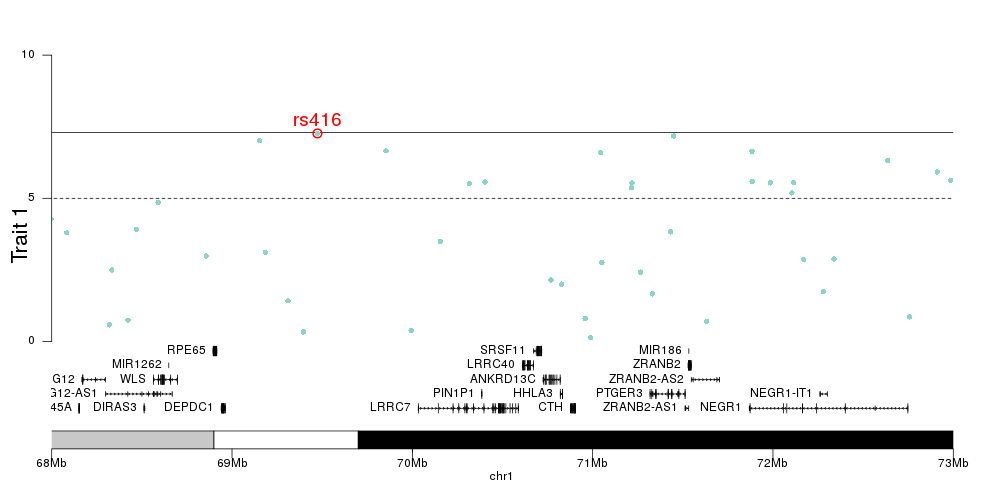
You can also use karyoploteR to get Manhattan plots with numeric or non-numeric chromosome identifiers.
You can use the kpPlotManhattan function for that. It can work with any genome, even with incomplete genomes, so it should work with scaffolds only (it will treat each scaffold as a chromosome). And it can import PLINK files.
You should:
1 - Create a custom genome file (or data.frame) with one line per scaffold and their length. 2 - Plot the ideogram of your custom genome calling plotKaryotype with your custom genome 3 - Call kpPlotManhattan to plot your data. You can even give it the name of your data files and it will automatically import and plot them (will work with plink files and other tabular formats)
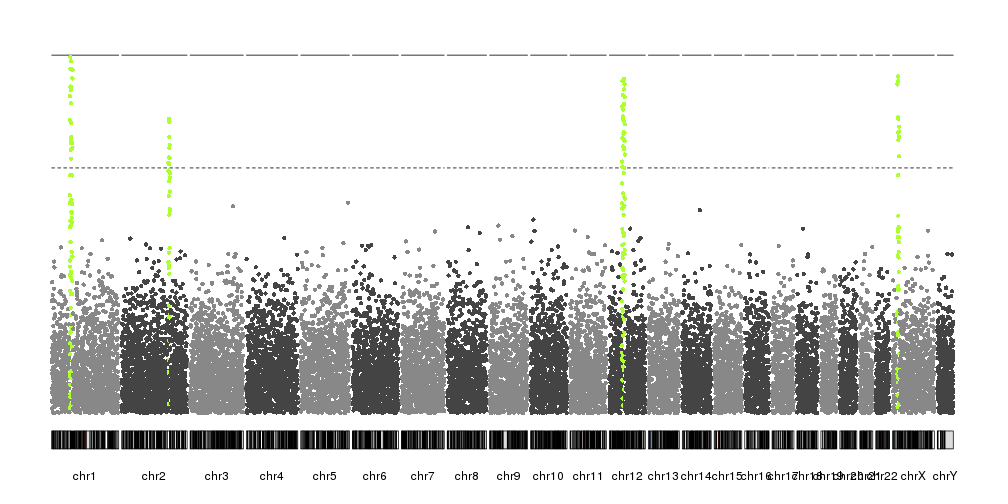
You can then, if you want, customize the plot or combine it with any other data using other karyoploteR functions. You'll find more information in the karyoploteR tutorial.
Log in to answer this question.
qqman does not seem feasible since I have ~ thousands unique scaffold names.. But if you still know a better way to use qqman for so many chr's, I am open any suggestions.