Hello Everyone
I am new to NGS and trying to plot a Genomic landscape having information of CpG methylation over adjacent 1000 bps width window data.
My file looks like this:
- chr1 0 1000 12.6
- chr1 1000 2000 45.8
- chr1 2000 3000 31.3
- chr1 3000 4000 10.2
where the last column has values to be plotted over all the chromosomes of Arabidopsis thaliana. So how can i plot a data in which x-axis has the chromosome length with in between its centromere and y-axis will be having the value of methylation.
Thanks in advance
Chandan Kumar
1 answer
Hi Chandan Kumar,
To plot data like this you can use karyoploteR, an R/Bioconductor package to plot data over the genome.
To plot on Arabidopsis thaliana you just need to install the BSgenome package for TAIR9 with
BiocManager::install("BSgenome.Athaliana.TAIR.TAIR9")
And the when creating the karyoplot add genome="TAIR9" and that will create a karyoplot for Arabidopsis thaliana.
Then, you can add your data using kpPoints or kpLines for example.
The code below
kp <- plotKaryotype(genome="TAIR9", main="Methylation level per Mb", cex=2)
kpAddBaseNumbers(kp, tick.dist = 5000000, minor.tick.dist = 1000000, add.units = TRUE, cex = 0.8)
kpLines(kp, data=cpgs, y=cpgs$mean.meth, col="gray50")
kpPoints(kp, data = cpgs, y=cpgs$mean.meth, cex=1.2)
kpAxis(kp, ymin=0, ymax=100)
would get you this image (with 1000 times more points! if you are using such small windows I'd remove the line).
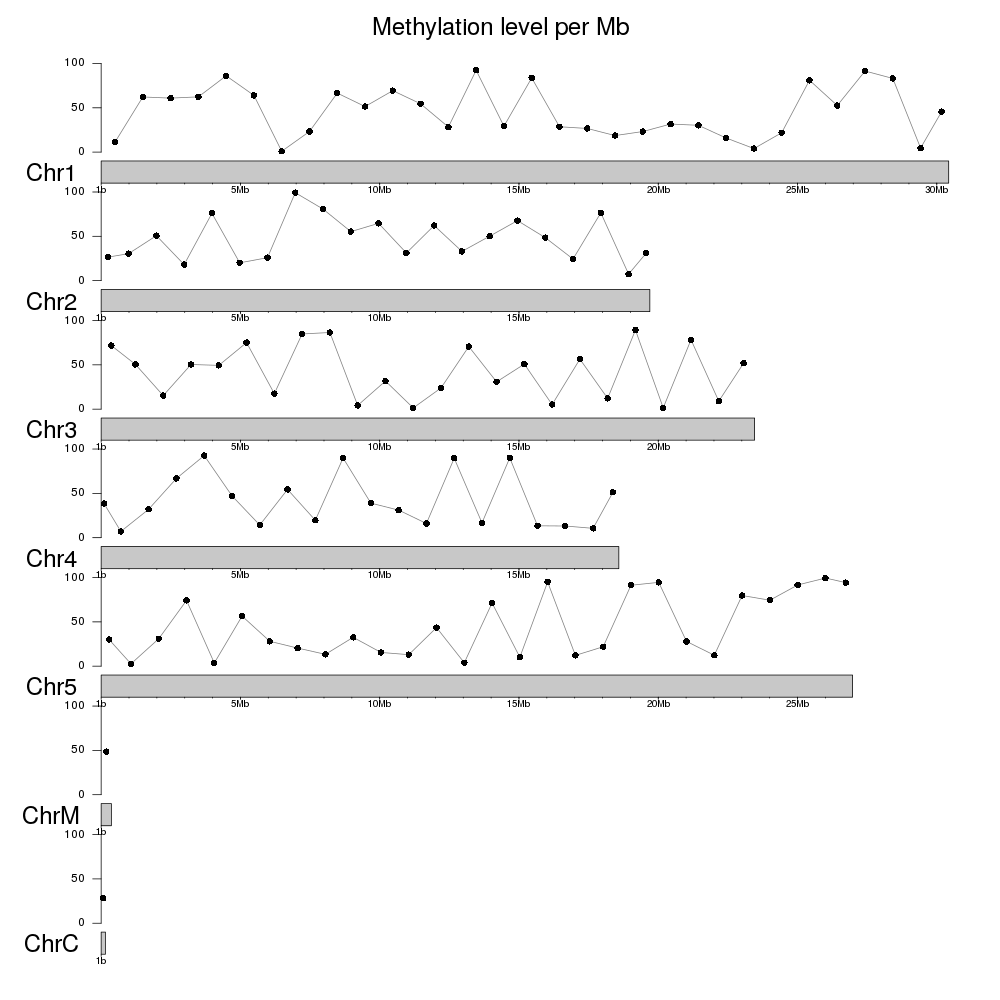
You can customize the image however you want, add other data types and values and zoom in to plot only a small part of the genome. You can find more information in the karyoploteR tutorial
Hope this helps
Log in to answer this question.
Make .seg file and drag-n-drop it to IGV: https://software.broadinstitute.org/software/igv/SEG