Adding ggplot2 chromosome position variable
2
2
Entering edit mode
4.4 years ago
rbronste ▴ 420

Hi pretty basic question, but I have a data.frame that looks as follows:

  chrom   start    stop frag        dev span
1  chr1 3466334 3466335   60 0.09543313 0.94
2  chr1 4970790 4970791   51 0.08546289 1.00
3  chr1 5022767 5022768   27 0.45680640 0.20
4  chr1 5022807 5022808   34 0.35155312 0.20
5  chr1 5022904 5022905   45 0.12787640 0.20
6  chr1 5023063 5023064   29 0.26792518 0.20

I am trying to do a scatter plot at specific genomic locations, just not sure how to limit it to the right chromosome, here is my ggplot2 command:

my_data %>% ggplot() + geom_point(aes(x = start, y = frag)) + scale_y_continuous(limits=c(0,80)) + xlim(109005904, 109017426) + xlab("Genomic Position") + geom_smooth(aes(x = start, y = frag), method="loess", span=.66, color = "red", fill = "black") + theme_bw()

Thanks!

ggplot2 plot genomic ranges R • 2.6k views
ADD COMMENT
4
Entering edit mode
4.4 years ago
zx8754 11k

Maybe:

my_data %>% filter(chrom == "chr1") %>% ggplot() + ...
ADD COMMENT
2
Entering edit mode
4.4 years ago
bernatgel ★ 3.4k

Hi rbonste

If you are wiling to move out of the ggplot space, you could use the Bioconductor package karyoploteR(https://bioconductor.org/packages/karyoploteR/), a tool specifically designed for the type of work you need, to plot data on genomes.

To use it you'll need to: first, create an empty (with no data, only the ideograms) karyoplot using plotKaryotype and them use kpPoints to add your data.

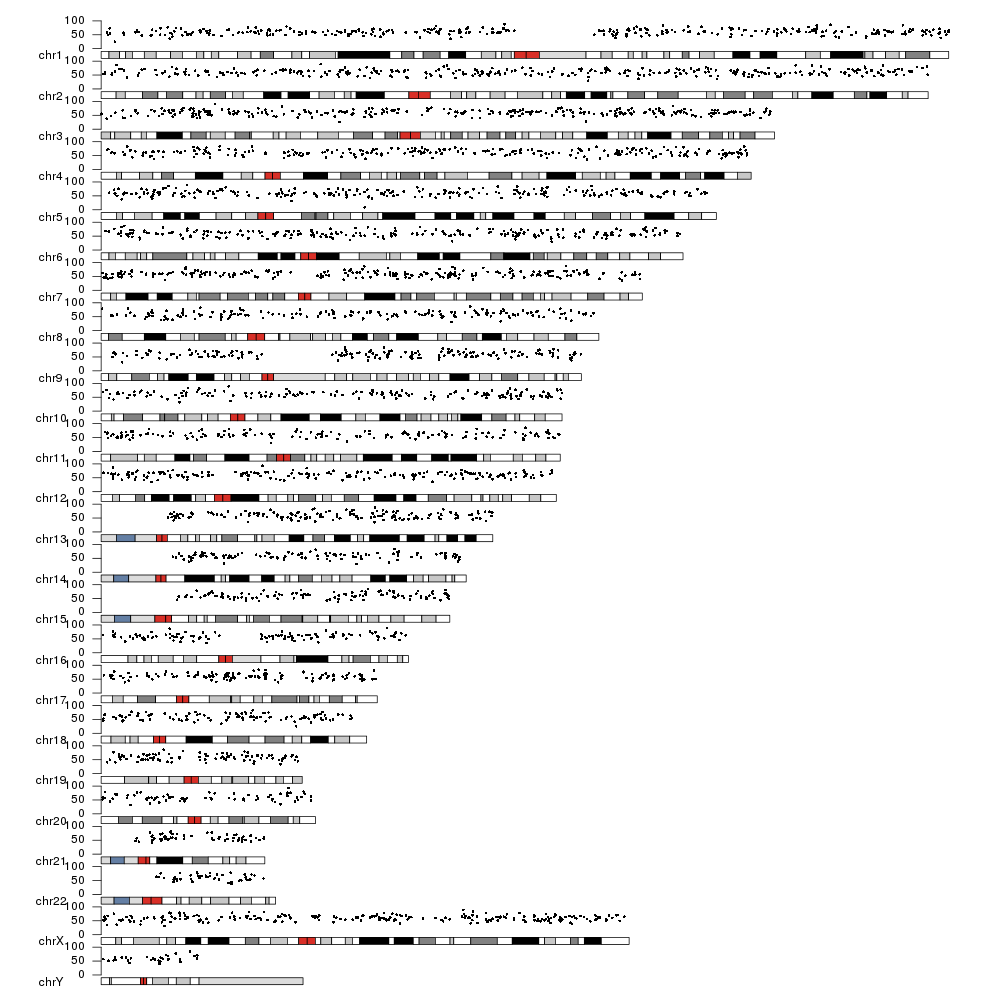
kp <- plotKaryotype("hg19")
kpAxis(kp, ymin = 0, ymax=100)
kpPoints(kp, my.data, y=my.data$frag, ymin=0, ymax=100)

And you'd get an image like this one

data points plotted on a whole genome

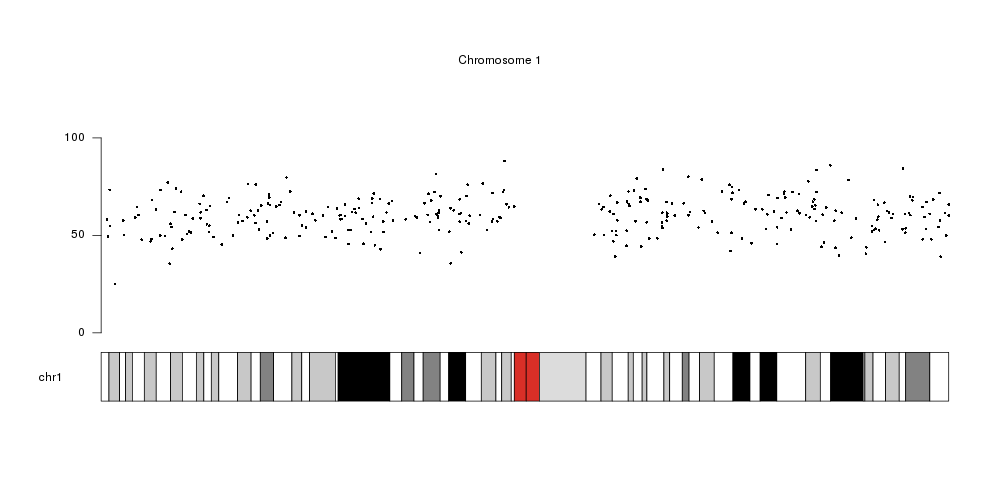
If you want to plot the data in a single chromosome you can select it in the first function call with chromosomes="chr1"

kp <- plotKaryotype("hg19", chromosomes = "chr1", main="Chromosome 1")
kpAxis(kp, ymin = 0, ymax=100)
kpPoints(kp, my.data, y=my.data$frag, ymin=0, ymax=100)

data points plotted in chromosome 1

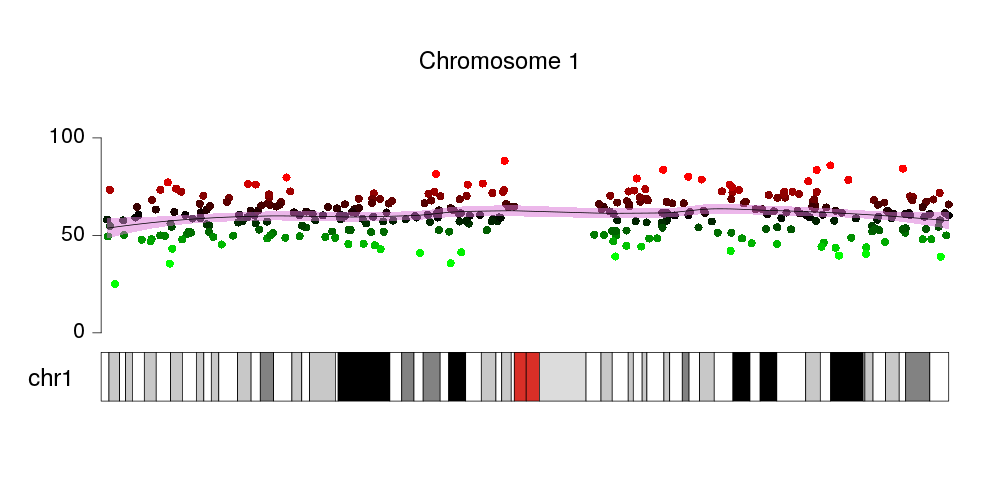
In addition, you can add additional information such as a LOESS fit or other data types, or customize the font sizes or point colors to get to this

kp <- plotKaryotype("hg19", chromosomes = "chr1", main="Chromosome 1", cex=2)
kpAxis(kp, ymin = 0, ymax=100, cex=1.8)
point.colors <- colByValue(my.data$frag, colors = c("green", "black","red"), min = 40, max=80)
kpPoints(kp, my.data, y=my.data$frag, ymin=0, ymax=100, col=point.colors, cex=1.5)
kpPlotLoess(kp, my.data, y=my.data$frag, ymin=0, ymax=100, ci.col = transparent("orchid"))

Customized plot with LOESS fit over genome

You can find more information on how to use karyoploteR in the tutorial page.

ADD COMMENT

Login before adding your answer.

Traffic: 1861 users visited in the last hour
Help About
FAQ
Access RSS
API
Stats

Use of this site constitutes acceptance of our User Agreement and Privacy Policy.

Powered by the version 2.3.6