
Hello,
I don't understand something with the CheckM software. I read the documentation about the "strain heterogeneity" and it is said that the heterogeneity is determined from the number of multi-copy marker pairs which exceed a specified amino acid identity threshold (default = 90%) .
But I don't understand when it is said *"High strain heterogeneity suggests the majority of reported contamination is from one or more closely related organisms (i.e. potentially the same species), while low strain heterogeneity suggests the majority of contamination is from more phylogenetically diverse sources."
I would like to say that a high heterogeneity suggests that the organisms are not related and the contrary with a low heterogeneity. As I understand the word "heterogeneity" , it means a disparity between data. And consequently, an high disparity should represent unrelated organisms.
Any help to explain me?

Thanks for your answer. It is more clear for me. If you look at my CheckM results, they look pretty bad or nonetheless, I can say that the bins found are unrelated and do not correspond to a same species, right?
Also, can we consider each bin here as a MAG? If yes, how do you consider a "good" MAG, or at least a bin which really corresponds to a real MAG? I read a paper that says a "real" MAG is a one with <10% contamination or completness is 5*contamination>50 . It looks right for you?
This paper deals with completeness criteria for MAGs.
All of your double-digit bins and
bin_6have low completeness. However starting withbin_8and everything below it, you have at least 70% complete (meta)genomes. The question is whether you can separate those bins better to get a cleaner picture. Don't know how you did binning, but try a more stringent approach on the bins that you already have. For example, takebin_4sequences and see whether you can separate it into sub-bins, say by using t-SNE with smaller perplexity (20-30).If you can't get a more granular picture, it seems to me that you have several related (sub)species in each of those lower bins.
Thanks for the answer. They have a low completness because they have a very low contamination, right? For the moment, there is not a real proof of taxonomic unit ? And if yes, at what level?
I retried to use CheckM on another dataset, I get this result :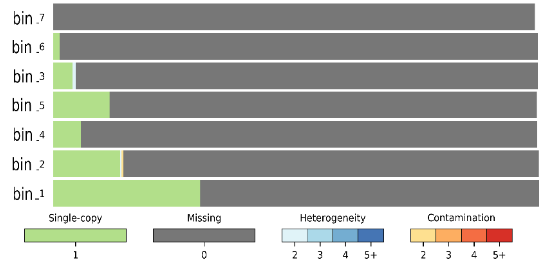
I don't know what I have to think about my result. I do not have any contamination or any heterogeneity.. Does that mean that the bin correspond to related species ? And how do you calculate the completness of the different bins because I didn't understand how you did for the previous results?
Thanks a lot
The only thing I can conclude from this graph is that you have 7 pure bins that are very incomplete. Why are they incomplete? Because they have at most 30% of marker genes present in single copy, and other marker genes are missing. That's what the gray-bar legend is telling you, and it seems pretty obvious to me.
You cannot conclude anything from this image about the relatedness between the bins, because each bin is independent from the others for the purposes of this analysis. We can only conclude about the relatedness of (meta)genomes WITHIN the same bin, but that's only applicable to bins that have blue or red colors in them.
I think these plots will become more intuitive after you familiarize yourself with details from the CheckM Wiki.
I think at some point you need to learn how to interpret these graphs rather than expecting me to explain you everything, and especially so because my explanations seem not to be working.
The meaning of bars and colors underneath is linked to the number of marker genes that are found in a bin. Let's say that there are 150 single-copy marker genes. Top six bars in your big graph are all gray, which means that they have 0 marker genes found. Green color is for marker genes that are found in 1 copy (that's why it says
Single-copyand1is under the green bar). Ideally, you'd want each bin to be filled completely in green color, or as much as possible in green and the rest in gray. If green and gray are the only two colors in each bin, that means that the bin is "pure" and represents a single species, because either marker genes are present in a single copy like they should or they are missing. Let's say that any bin that has more than 30% gray is incomplete, because it is missing 30% of marker genes. That's why I said that most of your bins starting from the top have low completeness, because they have lots of gray color in them.Lastly, blue and various shades of orange and red represent multiple copies of single marker genes which should not be happening if you have a single genome per bin. The number and distribution of these multiple-copy genes tells us something about heterogeneity of the bin, which is what I was trying to explain in my original reply. I suggest you read the CheckM paper and the explanations on their web site as to how to interpret when the majority of your bin is colored blue or red.
I'll explain your second figure below.
Hi, how did you manage to get this plot ? Thank you :)