Hi @aiswaryabioinfo
You can use karyoploteR as @RamRS has suggested with this data and it can do what I think you are requesting.
The first you need is to read the data and make a GRanges with the genes
library(karyoploteR)

#read the genes data
genes.to.plot <- read.table("genes.txt", header=TRUE, sep="\t", stringsAsFactors=FALSE)
#change to order of columns and create a GRanges
genes.to.plot <- toGRanges(genes.to.plot[c(2,3,4,1)])
Since I don't know the species you are working with, we can just create a custom genome with a size of 135.06Mb size.
#Create a custom genome with only your chromosome
custom.genome <- toGRanges("4:1-135060000")
And finally, we can plot the chromosomes with the genes. There are multiple ways of plotting them, in this code we'll be plotting them as rectangles (with kpPlotRegions) and as markers (with kpPlotMarkers).
#start plotting
kp <- plotKaryotype(genome = custom.genome)

#plot genes as rectangles
kpPlotRegions(kp, data = genes.to.plot, r0=0, r1=0.1)

#and as "markers"
kpPlotMarkers(kp, data = genes.to.plot, labels = genes.to.plot$gene, r0=0.15, r1=1)
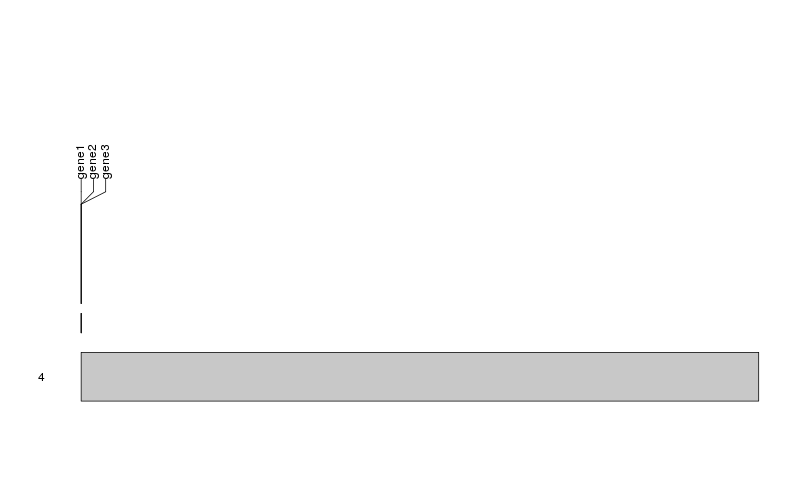
If you want to plot only a part of the chromosome we only need to set the zoom parameter in plotKaryotype.
#start plotting
kp <- plotKaryotype(genome = custom.genome, zoom="4:1-10000")

#plot genes as rectangles
kpPlotRegions(kp, data = genes.to.plot, r0=0, r1=0.1)
kpPlotNames(kp, data = genes.to.plot, y0=0, y1=1, labels = genes.to.plot$gene, position = "top", r0=0, r1=0.1)

#and as "markers"
kpPlotMarkers(kp, data = genes.to.plot, labels = genes.to.plot$gene, r0=0.25, r1=0.8)
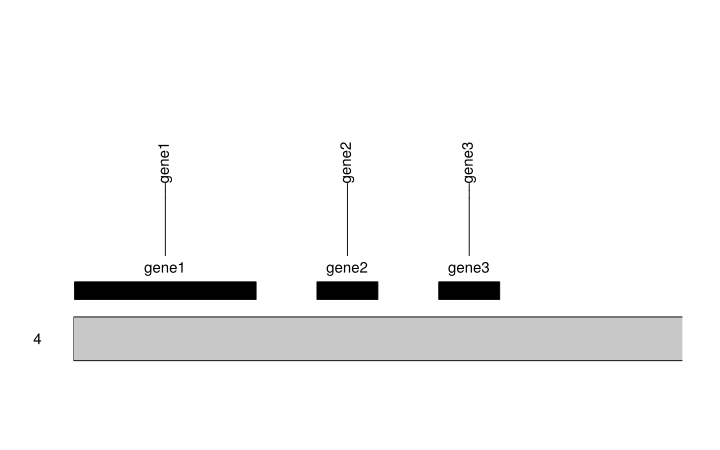
Once you are here you can customize your plot in many ways or add other data in addition to the gene positions. You can find all the information in the karyoploteR tutorial
Hope this helps
Bernat
Have you looked at karyoploteR?
I have checked karyoploteR but it is not serving my purpose
my data is like this
I want to mark this genes in corresponding chromosome and make a graph. There are many tools for organelle genomes like ogdraw. But as my genes are not oriented to any organelle i am finding it difficult to make. Kindly suggest me any other tools or packages
Might have a look at this: Creating chromosome karyotype plot with R and ggplot2