Entering edit mode

5.3 years ago
Grace_G
▴
20
Here is part(sorry, it's already shows what I want reflect) of my maplot 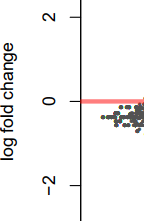
The relative distribution of all red point and black point are okay, what is different with normal MAplot is the global plot lower than we expected in general, I mean it's "roughly symmetry line" lower than y=0.
I checked my workflow, use res_diff, which get from res_diff <- results(dds2, pAdjustMethod = "BH")
I checked all what I can think of, still don't know what's wrong here?
Thanks for any view!
Please add a proper image and not such a cropped one. It is unclear what you are asking without a proper plot.
Thanks! The plot position of right one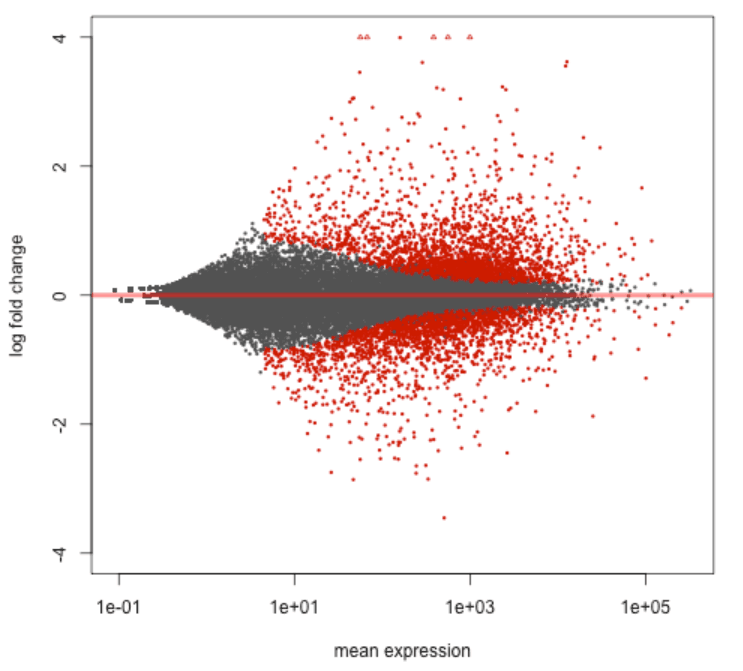 like this, "roughly symmetry line" at y=0!