Uncertain about using cqnplots for quality control
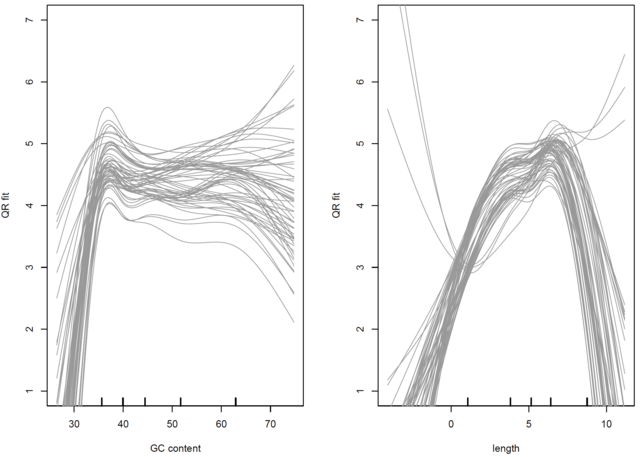
When doing quantile normalization of RNA-seq data using cqn. The vignette examines the output using cqnplot to generate two graphs, but doesn't go into detail as to what to look for in terms of issues with the normalization. In this data, there appear to be three samples that don't follow the same pattern on the right. Is that bad?
• 1,099 views
•
link
0 answers
No answers yet.
Log in to answer this question.