Thank you Chirag, Appreciate.
• 1 views
•
link
For downstream data analysis, how can I use tidy gather function for df with more than one header,
I want to plot a timecourse experimental data of 5 genotypes in a one bar plot like below

example df
structure(list(X1 = c("0d", "WT", "0", "0", "0", "0", "0", "0", "0", "0", "0", "0", "0", "0", "0", "0", "0", "0", "0", "0", "0", "0"), X2 = c("0d", "aox2-1", "0", "0", "0", "0", "0", "0", "0", "0", "0", "0", "0", "0", "0", "0", "0", "0", "0", "0", "0", "0" ), X3 = c("0d", "aox5-1", "0", "0", "0", "0", "0", "0", "0", "0", "0", "0", "0", "0", "0", "0", "0", "0", "0", "0", "0", "0" ), X4 = c("0d", "aox7-2", "0", "0", "0", "0", "0", "0", "0", "0", "0", "0", "0", "0", "0", "0", "0", "0", "0", "0", "0", "0" ), X5 = c("0d", "aox9-1", "0", "0", "0", "0", "0", "0", "0", "0", "0", "0", "0", "0", "0", "0", "0", "0", "0", "0", "0", "0" ), X6 = c("12h", "WT", "0.646", "0.632", "0.658", "0.635", "0.649", "0.692", "0.687", "0.669", "0.663", "0.681", "0.689", "0.666", "0.677", "0.664", "0.652", "0.651", "0.641", "0.657", "0.658", "0.642"), X7 = c("12h", "aox2-1", "0.653", "0.619", "0.611", "0.644", "0.597", "0.605", "0.581", "0.588", "0.624", "0.619", "0.635", "0.626", "0.625", "0.63", "0.612", "0.633", "0.636", "0.586", "0.633", "0.609"), X8 = c("12h", "aox5-1", "0.635", "0.609", "0.604", "0.601", "0.622", "0.591", "0.569", "0.585", "0.576", "0.56", "0.609", "0.583", "0.561", "0.62", "0.651", "0.587", "0.642", "0.621", "0.574", "0.573"), X9 = c("12h", "aox7-2", "0.541", "0.532", "0.566", "0.537", "0.6", "0.571", "0.6", "0.594", "0.594", "0.592", "0.516", "0.54", "0.515", "0.557", "0.607", "0.586", "0.549", "0.557", "0.531", "0.56"), X10 = c("12h", "aox9-1", "0.616", "0.608", "0.615", "0.614", "0.652", "0.641", "0.629", "0.623", "0.613", "0.607", "0.585", "0.575", "0.633", "0.632", "0.561", "0.571", "0.563", "0.62", "0.565", "0.565"), X11 = c("24h", "WT", "0.739", "0.732", "0.732", "0.72", "0.716", "0.744", "0.747", "0.726", "0.737", "0.74", "0.724", "0.73", "0.708", "0.711", "0.717", "0.739", "0.738", "0.709", "0.722", "0.752"), X12 = c("24h", "aox2-1", "0.732", "0.715", "0.707", "0.725", "0.727", "0.727", "0.728", "0.736", "0.734", "0.731", "0.713", "0.709", "0.71", "0.718", "0.738", "0.708", "0.728", "0.721", "0.72", "0.714"), X13 = c("24h", "aox5-1", "0.746", "0.735", "0.713", "0.716", "0.746", "0.728", "0.745", "0.752", "0.726", "0.713", "0.71", "0.721", "0.715", "0.713", "0.712", "0.738", "0.741", "0.737", "0.729", "0.719"), X14 = c("24h", "aox7-2", "0.706", "0.714", "0.715", "0.695", "0.696", "0.714", "0.703", "0.672", "0.677", "0.694", "0.686", "0.706", "0.724", "0.726", "0.706", "0.694", "0.709", "0.725", "0.714", "0.711"), X15 = c("24h", "aox9-2", "0.723", "0.715", "0.706", "0.702", "0.702", "0.733", "0.726", "0.732", "0.725", "0.719", "0.719", "0.711", "0.699", "0.713", "0.705", "0.732", "0.725", "0.729", "0.723", "0.721")), row.names = c(NA, -22L), class = c("tbl_df", "tbl", "data.frame"), spec = structure(list( cols = list(X1 = structure(list(), class = c("collector_character", "collector")), X2 = structure(list(), class = c("collector_character", "collector")), X3 = structure(list(), class = c("collector_character", "collector")), X4 = structure(list(), class = c("collector_character", "collector")), X5 = structure(list(), class = c("collector_character", "collector")), X6 = structure(list(), class = c("collector_character", "collector")), X7 = structure(list(), class = c("collector_character", "collector")), X8 = structure(list(), class = c("collector_character", "collector")), X9 = structure(list(), class = c("collector_character", "collector")), X10 = structure(list(), class = c("collector_character", "collector")), X11 = structure(list(), class = c("collector_character", "collector")), X12 = structure(list(), class = c("collector_character", "collector")), X13 = structure(list(), class = c("collector_character", "collector")), X14 = structure(list(), class = c("collector_character", "collector")), X15 = structure(list(), class = c("collector_character", "collector"))), default = structure(list(), class = c("collector_guess", "collector"))), class = "col_spec"))
See below if it make sense.
d <- inputdata

## extract headers
headers <-d  %>%  dplyr::slice(c(1:2))

## extract data
data <- d  %>%  dplyr::slice(-c(1:2)) %>% mutate_all(as.numeric)

## make header in to one row

headers <- headers %>% summarise_all(function(.) {paste0(rev(.), collapse = "_")})
headers
# A tibble: 1 x 15
  X1    X2        X3        X4        X5        X6     X7         X8         X9         X10        X11    X12        X13        X14        X15
  <chr> <chr>     <chr>     <chr>     <chr>     <chr>  <chr>      <chr>      <chr>      <chr>      <chr>  <chr>      <chr>      <chr>      <chr>
1 WT_0d aox2-1_0d aox5-1_0d aox7-2_0d aox9-1_0d WT_12h aox2-1_12h aox5-1_12h aox7-2_12h aox9-1_12h WT_24h aox2-1_24h aox5-1_24h aox7-2_24h aox9-2_24h

colnames(data ) <- headers

#plot

data %>% rowid_to_column() %>% as_tibble() %>%
gather(sample, value , -rowid) %>% separate(col = sample, into = c("strain" , "time") , sep = "_")  %>%
group_by(time) %>%
ggplot(aes(x = time, y =value)) + geom_bar(stat = "identity", aes(fill = strain) , position = "dodge") + theme_bw() + theme(text = element_text(size = 20))

ggsave(filename  = "~/Desktop/tt.png")
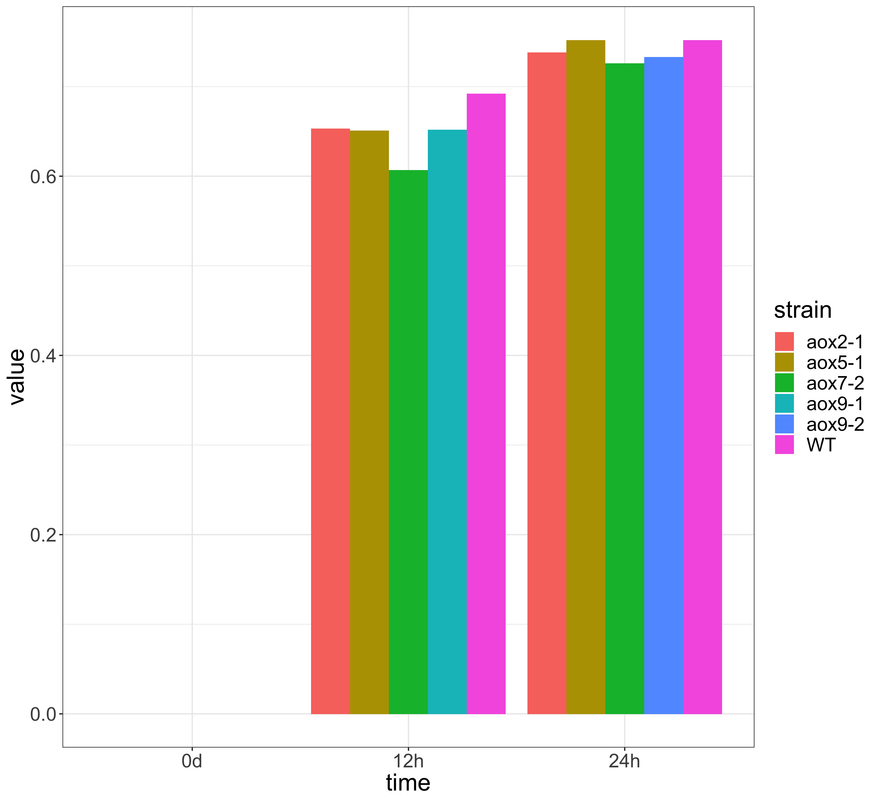
Thank you Chirag, Appreciate.
after some code cleaning:
names(df)=paste(df[1,], names(df),df[2,], sep = "_")
df=df[-c(1:2),]
df[,1:ncol(df)]=sapply(df[,1:ncol(df)], as.numeric) # this is necessary only if columns are not numeric

library(tidyverse)
library(ggplot2)

df %>%
  gather(type, value) %>%
  mutate(time = str_split_fixed(df1$type, "_", 3)[, 1], sample = str_split_fixed(df1$type, "_", 3)[, 3]) %>%
  ggplot(aes(time, value, fill=sample)) +
  geom_bar(stat="identity", position = "dodge")

Thanks a heap cpad0112 :) BTW, can you help me with the adding SE to the bars if possible.
Once wide format is converted to long format, use summarySE (from Rmisc librar) function to calculate SD, SE etc. Combine these values with long format data and use geom_errorbar function to plot error bars.
Hi cpad0112, don't you think using sapply , subsetting by [] and str_split_fixed makes less readable compare to using tidyverse verbs slice, summarise_all and separate. Just a thought. Nothing personal :)
sapply step is optional, as OP may have the numeric data and I kept it out of the tidyflow. For other stuff, your suggestions are good. Next time, would incorporate that.
some thing like this:
library(tidyverse)
library(ggplot2)

names(df)=paste(df[1,], names(df),df[2,], sep = "_")
df=df[-c(1:2),]


df %>%
  mutate_all(as.numeric) %>%
  gather(type, value) %>%
  separate(type, c("day","type","sample"), sep="_") %>%
  ggplot(aes(day, value, fill=sample)) +
  geom_bar(stat="identity", position = "dodge")
Log in to answer this question.