The link you provide does not explain why the broadPeak format is of disadvantage here.connect H3K4me3 with using broadPeaks. Please elaborate.
• 1 views
•
link
For ChIP-seq data of H3K4me3 histone modification. I used MACS2 to call peaks with default setting. However I identified a large number of peaks with length below 700bp. Those peaks look like vertical bars in IGV. Any opinions are greatly appreciated!!
Below is a subset of the narrowPeak file:
chr10   131364552       131365161       Peak_1  127     .       7.76171 12.79630        3.30580 286
chr8    133508303       133508979       Peak_2  93      .       6.03689 9.34294 2.21605 337
chr12   49445522        49445922        Peak_3  87      .       5.86739 8.77625 1.76287 219
chr10   73439426        73440041        Peak_4  76      .       5.17447 7.69945 0.80224 295
chr11   114011885       114012344       Peak_5  76      .       5.17447 7.69945 0.80224 177
chr11   1213144 1213654 Peak_6  76      .       5.17447 7.69945 0.80224 225
chr1    11661364        11661760        Peak_7  76      .       5.17447 7.69945 0.80224 144
chr11   66866515        66867011        Peak_8  76      .       5.17447 7.69945 0.80224 344
chr11   77008922        77009283        Peak_9  76      .       5.17447 7.69945 0.80224 242
chr1    201072066       201072625       Peak_10 76      .       5.17447 7.69945 0.80224 334

My suggestion would be don't use solely the narrowPeak file.
Follow the 2014 ENCODE directives and focus on using your gappedPeaks (definition: broadPeaks that contain at least one strong narrowPeak). Also, make sure that you use the ones that are consistent between replicates (you have those right!?) - one option is using IDR.
The link you provide does not explain why the broadPeak format is of disadvantage here.connect H3K4me3 with using broadPeaks. Please elaborate.
I beg to differ:
We used the gappedPeak representation for the histone marks with relatively compact enrichment patterns. These include H3K4me3, H3K4me2, H3K4me1, H3K9ac, H3K27ac and H2A.Z.
Sorry if I expressed myself wrong. I mean why why shouldn't you use narrowPeaks.
All I'm trying to do is answer OP's question. If their data is spikey (as seems to be the case) then using narrowPeaks is not going to be ideal. Whether this spikey-ness is due to a bad MACS command, bad experimental protocol, or simply just sequencing artifacts, it is really hard to tell without more details or actually seeing the files...
However, if the cause is just sequencing artifacts (or maybe OP isn't using an Input control) then using the gappedPeaks should be able to overcome this barrier and potentially allow OP to extract informative peaks.
I'm not saying you shouldn't use narrowPeaks - if they work, they work - and as such refined my original reply.
There are actually guidelines for specific marks:

Log in to answer this question.
So what's your question? H3K4me3 peaks are often relatively narrow.
Yes, H3K4me3 peaks are narrow. However I usually observed peaks with average length 2kb in high quality data. The short peaks(~700bp)look like spikes, not bell curved shapes.
maybe sharing a snapshot of such peaks will help us better understand any issues you may have with their appearance
How did you make your bigWig file? The 'fc' in the file name makes me think those values are fold change values for each region rather than actual reads. What does the BAM file look like for the same region if you throw it in IGV?
I think you're correct, the signal track is for fold change. I used AQUAS chip-seq pipeline to get this bigwig file.(https://github.com/kundajelab/chipseq_pipeline)
Below is the snapshot for the BAM file and fc bw file opened in the IGV: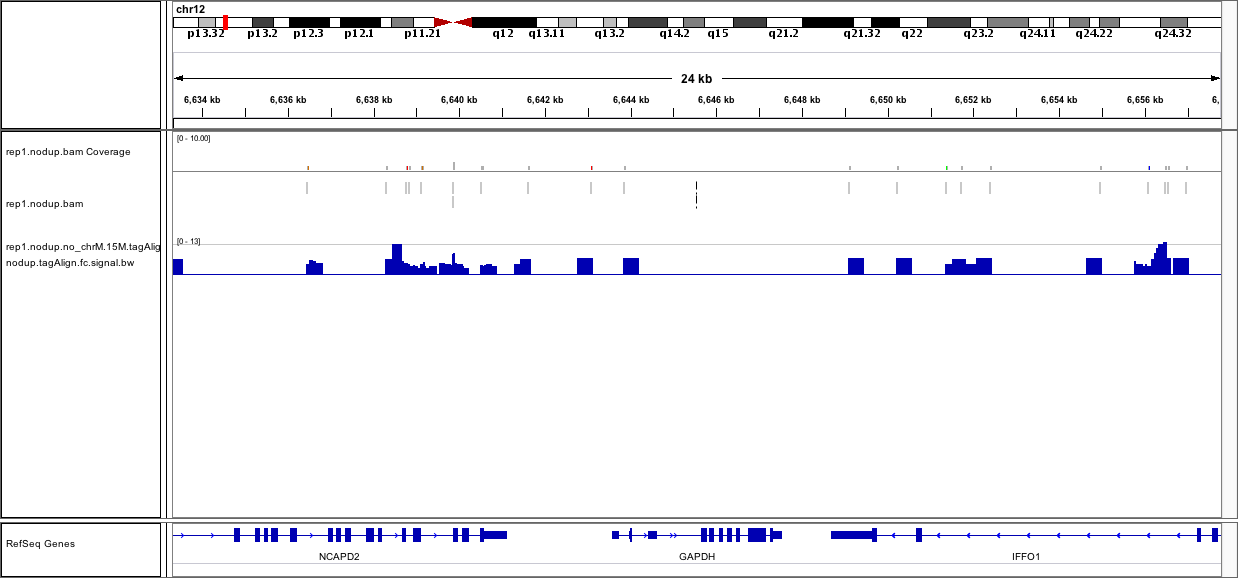
I just realized for the above shown data, the reads is only 2 million. Below is another data with 6 million reads: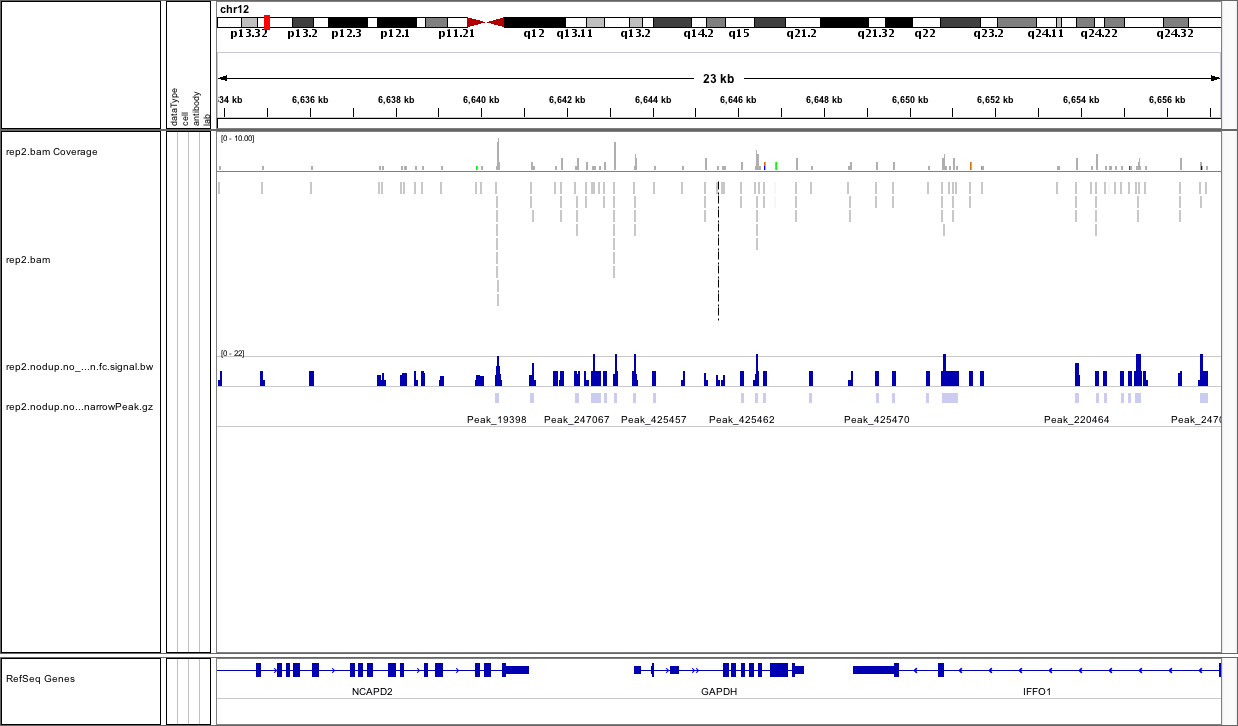
This data quality isn't looking too great to me. Seems like the coverage is just really low and that perhaps the ChIP didn't work very well - the GAPDH promoter should be a mountain in most decent quality data sets. I'd be skeptical of this data.
looks like fairly old (mod)ENCODE data...certainly not ideal and the problem is probably not primarily with the peak calling but the coverage as Jared pointed out