Add labels in the annotation bar of pheatmap
I have the code below to generate the heatmap with annotation. 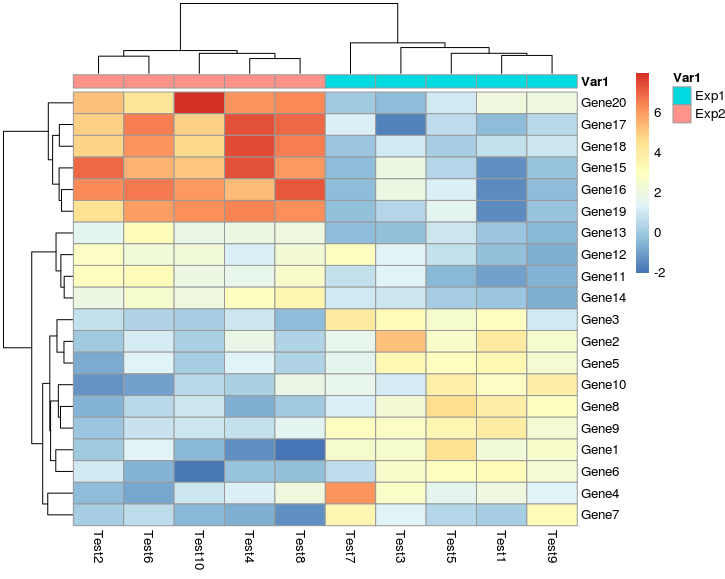
library(pheatmap)
# Generate some data
test = matrix(rnorm(200), 20, 10)
test[1:10, seq(1, 10, 2)] = test[1:10, seq(1, 10, 2)] + 3
test[11:20, seq(2, 10, 2)] = test[11:20, seq(2, 10, 2)] + 2
test[15:20, seq(2, 10, 2)] = test[15:20, seq(2, 10, 2)] + 4
colnames(test) = paste("Test", 1:10, sep = "")
rownames(test) = paste("Gene", 1:20, sep = "")
# Add annotation as described above, and change the name of annotation
annotation <- data.frame(Var1 = factor(1:10 %% 2 == 0, labels = c("Exp1", "Exp2")))
rownames(annotation) <- colnames(test) # check out the row names of annotation
pheatmap(test, annotation = annotation)
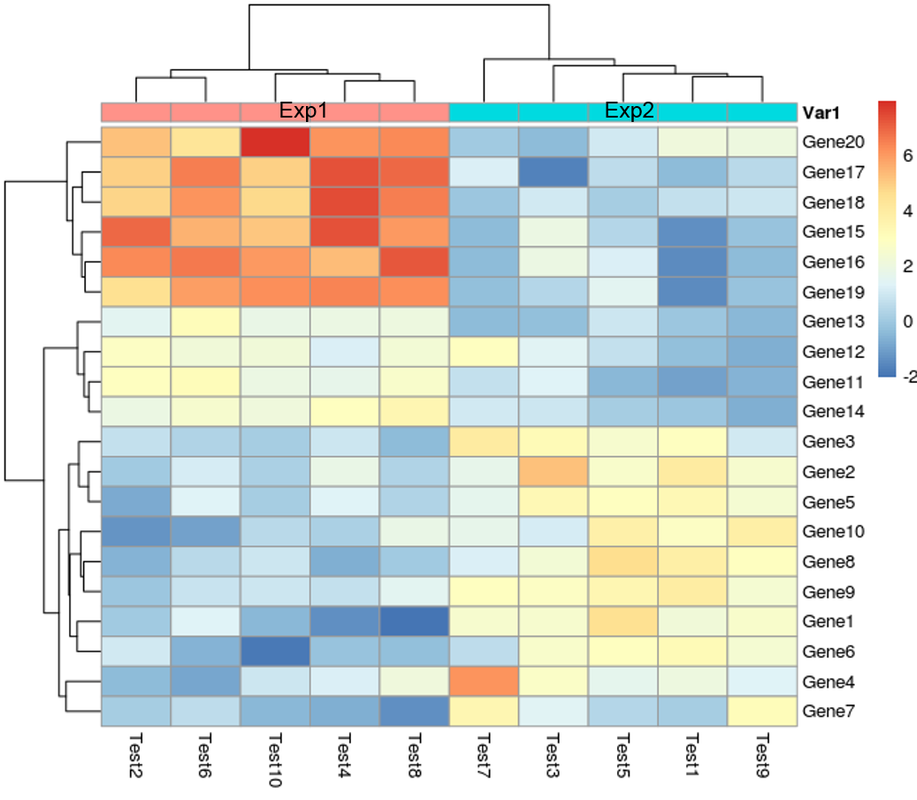
I'm wondering whether there is a way to add the labels in the annotation bar in R code. Thanks in advance.
• 17,853 views
•
link
2 answers
use grid.text (part of base functions, earlier part of library "grid") (play with x and y coordinates):
pheatmap(test, annotation = annotation)
grid.text(levels(annotation$Var1), x=c(0.25,0.6),y=c(0.89,0.89), gp=gpar(fontsize=10))

• 1 views
•
link
@cpad0112 has already provided an excellent solution and pointed out that pheatmap uses grid for plotting. However in the spirit of having more control of where the text will go, I would suggest adding the text directly in the viewport as it saves the time to play around with the xy coordinates.
pheatmaps.obj <- pheatmap(test, annotation = annotation)
library(grid)
showViewport()  #check viewport name
downViewport("col_annotation.3-3-3-3") # annotation
pheatmaps.obj <- pheatmap(test, annotation = annotation) # replot
grid.text(levels(annotation$Var1), x=c(0.25,0.75),y=c(0.5,0.5), gp=gpar(fontsize=5))
• 1 views
•
link
Log in to answer this question.
I think the simplest is just export as PDF and edit it in Adobe Illustrator