How to remove the squished track in Give AlignmentTrack()
I have the following code:
library(Gviz)
library(Mus.musculus)
library(data.table)
library(OrganismDbi)
library(TxDb.Mmusculus.UCSC.mm10.knownGene)
txdb <- TxDb.Mmusculus.UCSC.mm10.knownGene


# Define bam file -----

adipose_bam <- "myfile.bam"

# Define region -----------------------------------------------------------
thechr <- "chr3"
st <- 116.108e6L
en <- 116.1317e6L


# Define track ------------------------------------------------------------

itrack <- IdeogramTrack(
  genome = "mm10", chromosome = thechr
)

grtrack <- GeneRegionTrack(
  txdb,
  chromosome = thechr, start = st, end = en,
  showId = TRUE,
  name = "Gene Annotation"
)


gtrack <- GenomeAxisTrack(cex = 1) # set the font size larger

adipose_altrack <- AlignmentsTrack(
  adipose_bam,
  isPaired = TRUE, col.mates = "deeppink",
  name = "Adipose", fill = "blue", col = "blue"
)


plotTracks(
  list(itrack, gtrack, adipose_altrack, grtrack),
  from = st, to = en
)
It produces this plot: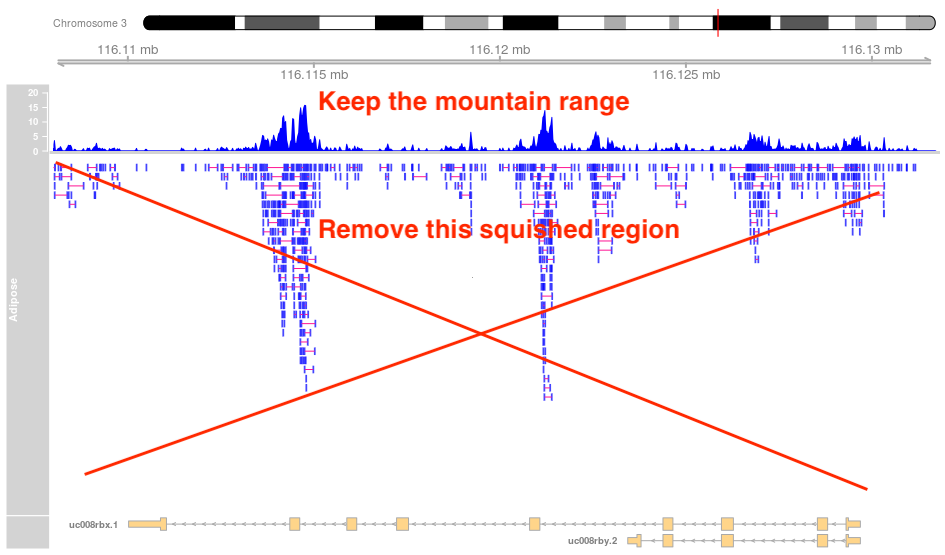
As define in the image how can I remove the squished track?
• 1,449 views
•
link
1 answer
This is probably way to late, but this post put me on the right track with my own work, so will provide this answer for others in the future..
Instead of using the AlignmentTracks class, use the DataTrack class to make a histogram coverage plot
adipose_covtrack <- DataTrack(test.bam,
                   genome = "mm10",
                   type = "h",  ## For histograms
                   name = "Adipose")
I haven't played around with the aesthetics, but the default setting provides blue fill.
• 0 views
•
link
Log in to answer this question.