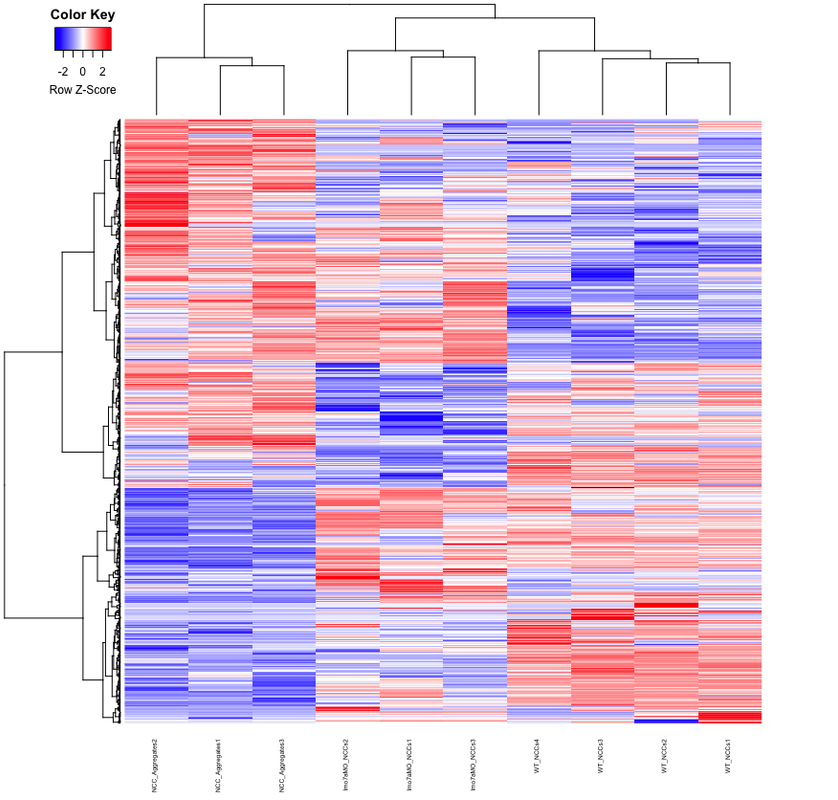
I have a dataset which consists of 3 groups of replicates the 1st and 2nd with 3 replicates each and the 3rd group with 4 replicates. I performed DE gene expression analysis using edgeR, and obtained a list of statistically significant genes in the form of a table of gene names and TPMs. I created a data matrix and log2-transformed it with the following code:
z <- data.frame(read.table("/Volumes/David_seq/RNAseq_data/5-1_2018_lmo7aMO aggregates bulk RNA-seq/DE_data/Sorted_NCCs_top800deGenes.txt", header = TRUE, sep = "\t"))

    row.names(z) <- z$Gene

    z <- z[,2:11]

z_matrix <- data.matrix(z)

z_log2matrix <- log2(z_matrix)
Next I performed hierarchical clustering with centroid linkeage and generated a heatmap.
    cor_t <- 1 - cor(t(z_log2matrix))

    distancet <- as.dist(cor_t)

    hclust_centroid <- hclust(distancet, method = "centroid")

    dendcentroid <- as.dendrogram(hclust_centroid)

    heatmap.2(z_log2normMatrix, Rowv = dendcomplete, Colv = TRUE, scale = "row", col = redblue(256), trace = "none",

    dendrogram = "both", cexCol = 0.5, density.info = "none", labRow = NA)
I know there are many ways to perform clustering, and I'm still a newbie. However, I was pleased with the initial results in that it provided me with the information I was looking for. In short, I'm looking for clusters of genes that are upregulated in the 1st group of replicates as compared to the 3rd group (WT), but not upregulated in the 2nd group as compared to the 3rd group (WT).
https://postimg.cc/image/bdsbe0sfb/
I don't know where to go from here. How do I pull out those clusters and put them into their own matrices?
edit: I'm not sure how to insert images, so I've included a URL to the heatmap so you can see what I'm talking about.
rna-seq
r
hierarchical
clustering