IMO, the best software for creating dotplots.
• 1 views
•
link
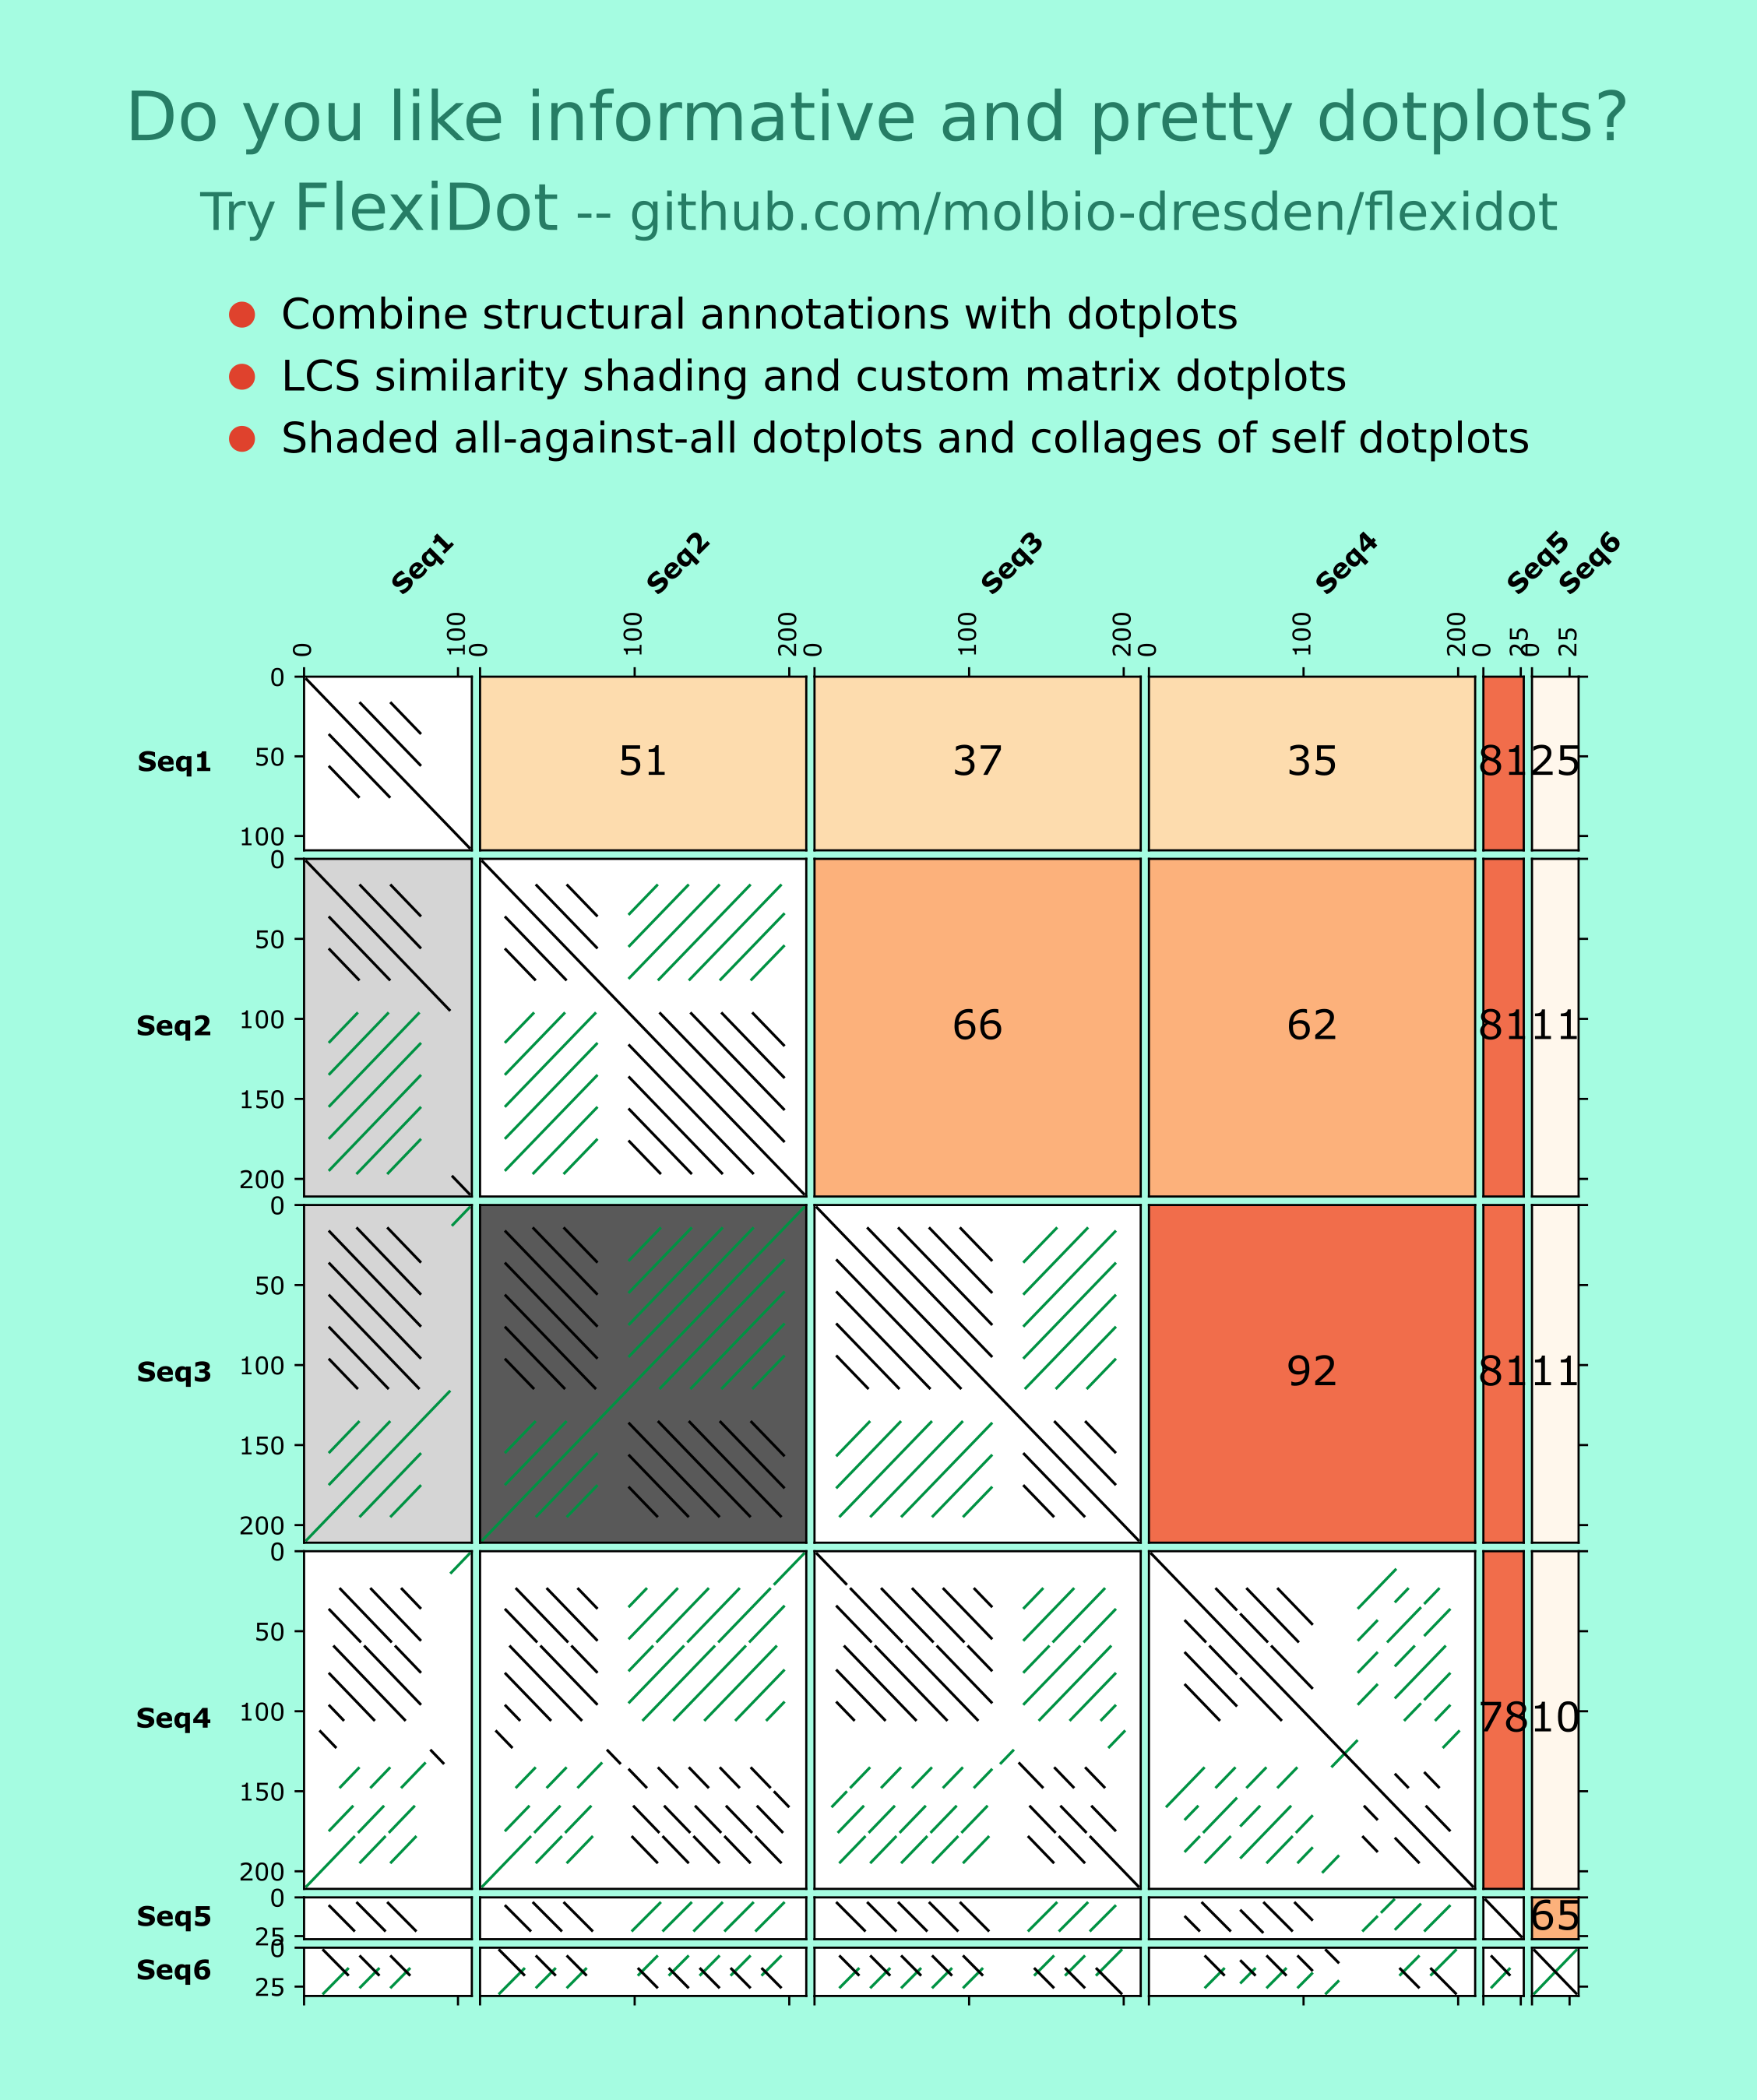
FlexiDot is a cross-platform dotplot suite generating high quality self, pairwise and all-against-all visualizations. To improve dotplot suitability for comparison of consensus and error-prone sequences, FlexiDot harbors routines for strict and relaxed handling of mismatches and ambiguous residues. The custom shading modules facilitate dotplot interpretation and motif identification by adding information on sequence annotations and sequence similarities to the images. Combined with collage-like outputs, FlexiDot supports simultaneous visual screening of a large sequence sets, allowing dotplot use for routine screening.
See for example this tutorial on adding gff3-type annotation to a dotplot.
Code, examples and documentation on github: http://github.com/molbio-dresden/flexidot
Publication: K. M. Seibt, T. Schmidt, and T. Heitkam (2018) "FlexiDot: Highly customizable, ambiguity-aware dotplots for visual sequence analyses". Bioinformatics, in press, http://doi.org/10.1093/bioinformatics/bty395
(Preprint: Latex version at Overleaf)
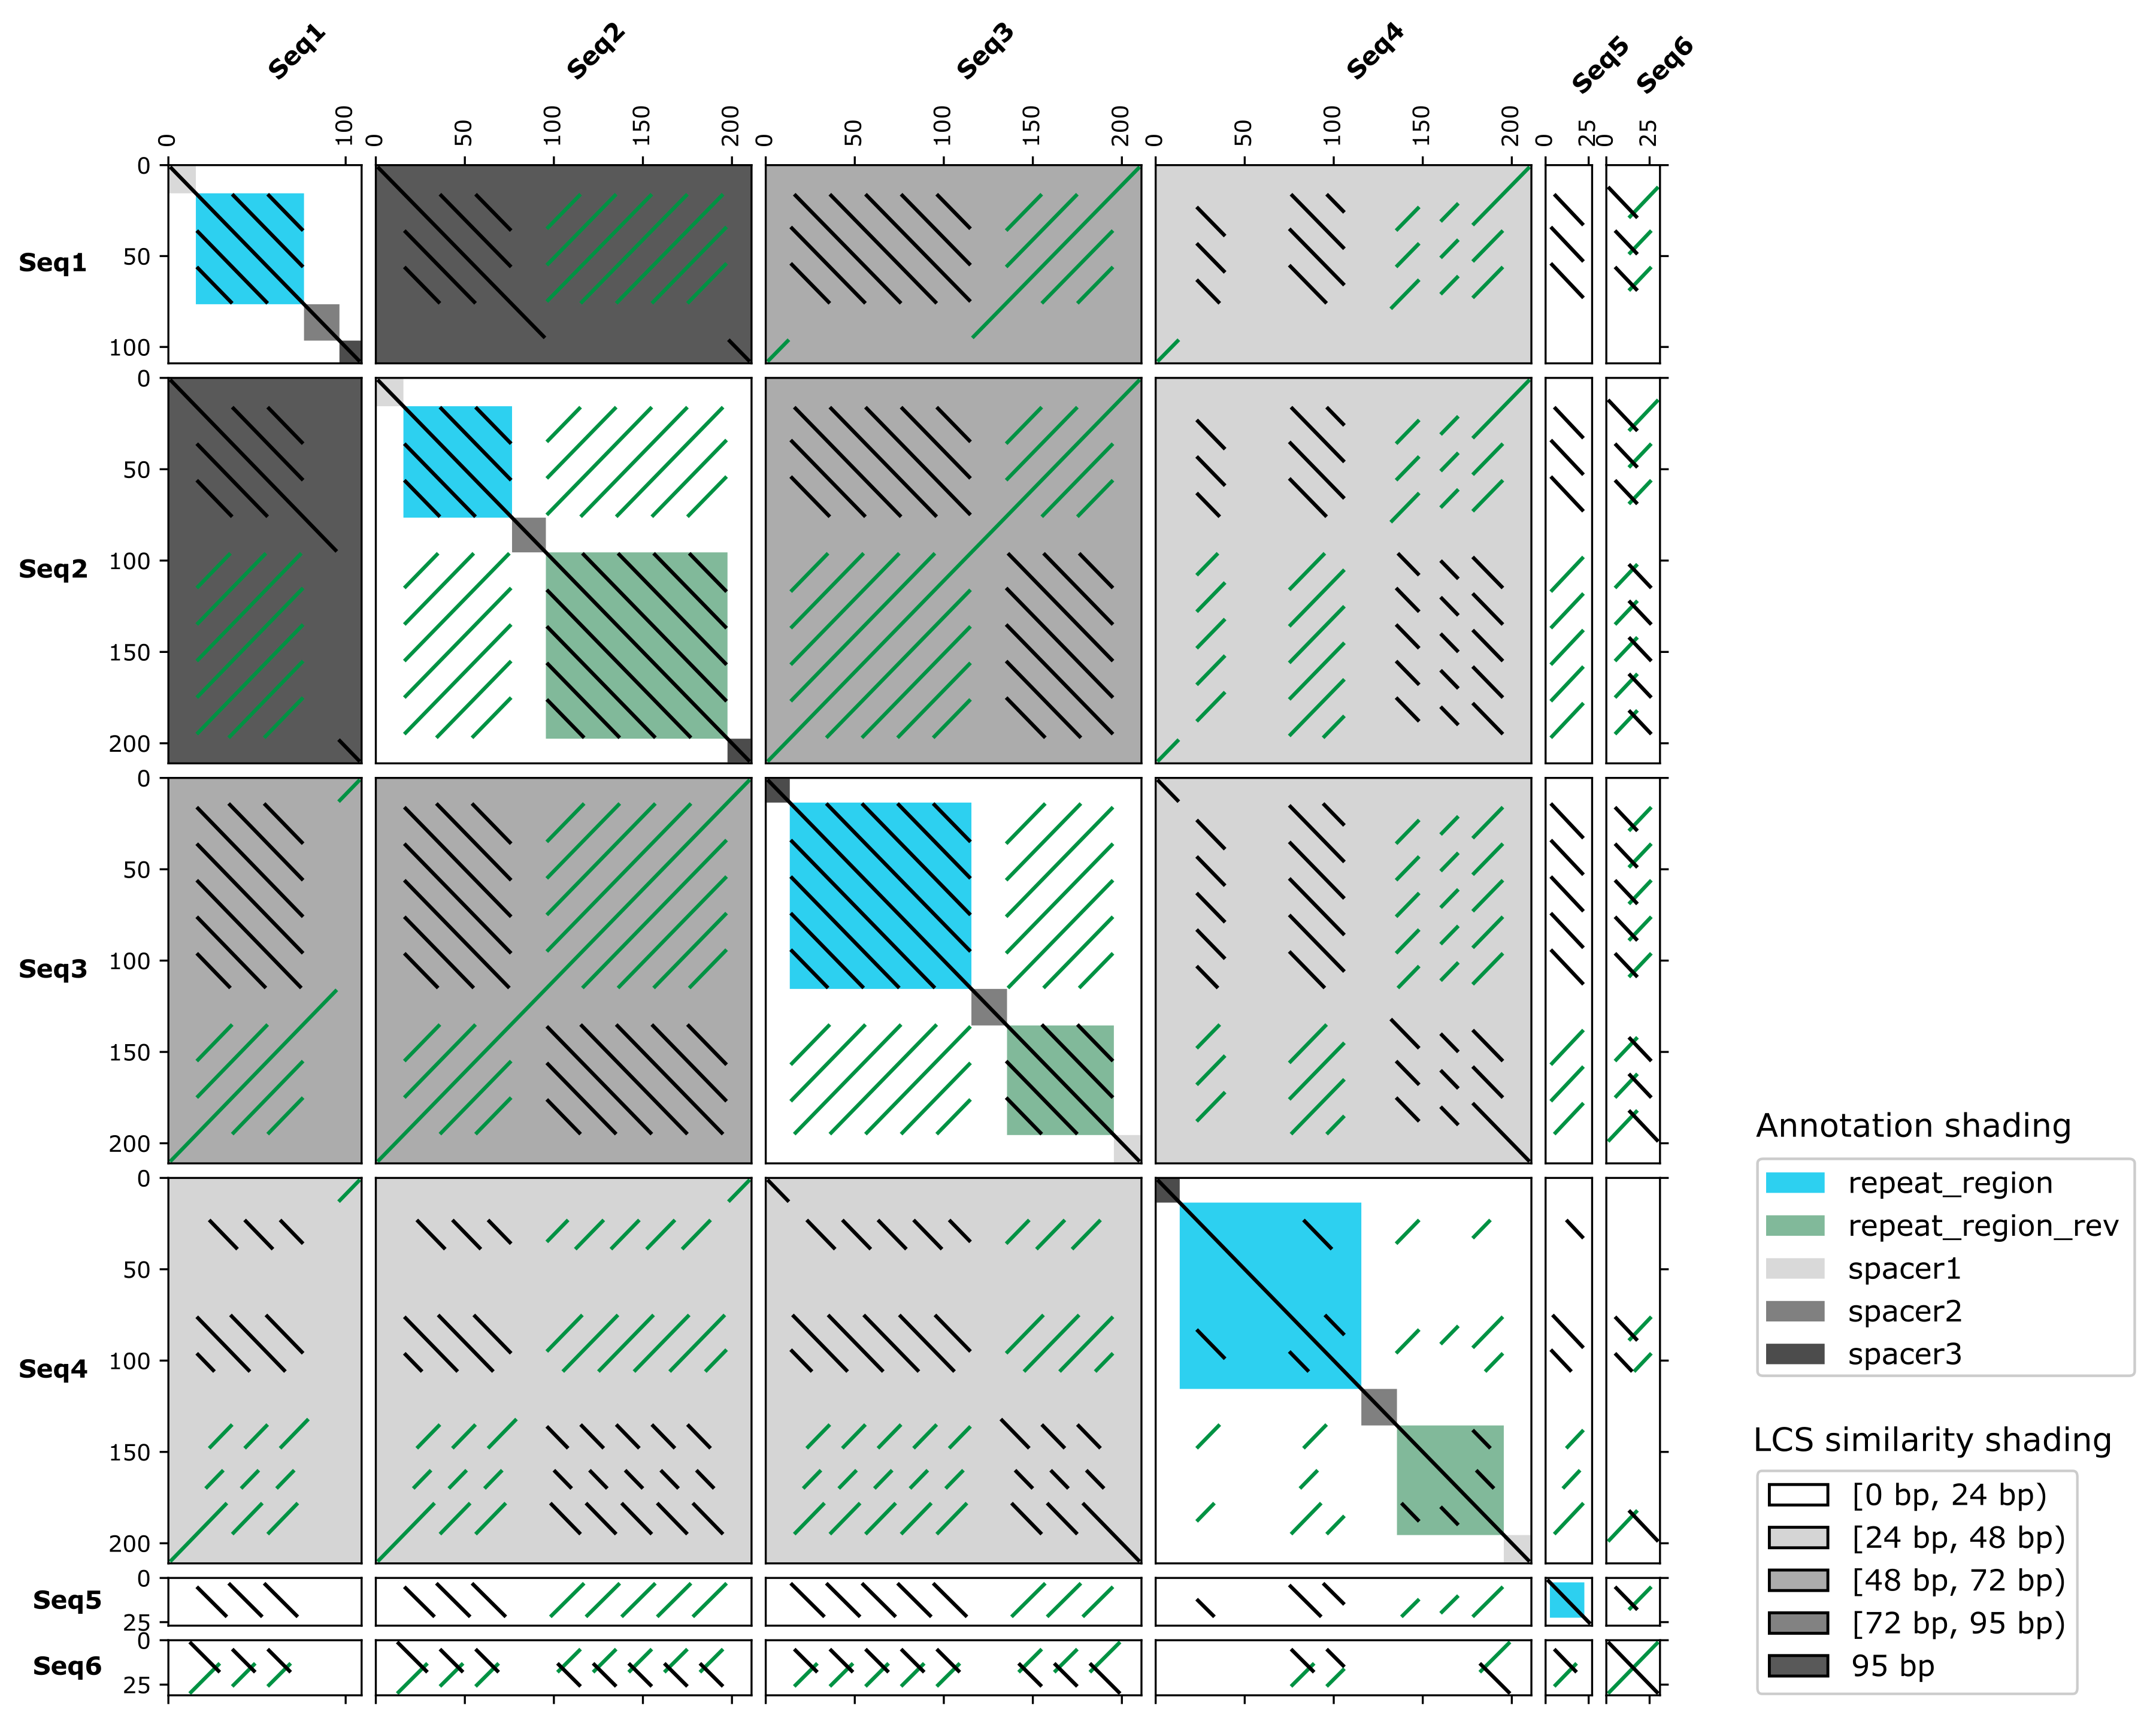
Previously only available for self dotplots, we added annotation-based shading to all-to-all dotplots, allowing for new visualizations. As before, annotation information is provided as general feature file (GFF3). These features are added to the middle diagonal (see our example below).
Code, examples and documentation on github: https://github.com/molbio-dresden/flexidot
Basic command:
python flexidot.py -i test-seqs.fas -g example2.gff3 -G gff_color.config -p 2
Command plus aesthetics as shown here (+ LCS shading, wordsize 10, change of subplot spacing and line width):
python flexidot.py -i test-seqs.fas -g example2.gff3 -G gff_color.config -p 2 -x y -k 10 -F 0.06 -A 1.5
IMO, the best software for creating dotplots.
Thank you a lot for saying this. It makes us happy, since we also love this tool.
It would be great to have an option to display dotplots according to cartesian coordinate system (i.e., Y axis from bottom to top, rather than from top to bottom).
Thank you for the suggestion! Some tools as e.g. the EMBOSS polydot package handle plots just like you suggested. (And we even actually plotted like this in very early FlexiDot versions, but then changed this, because most use it the other way round.)
I spoke to Kathrin (who is first authoring FlexiDot), if we want to do implement this - and she told me that it is already done! She just couldn't resist. So... we will have to rigorously test that everything behaves well, and then you'll probably get your very own -M (mirror) parameter. ;)
Wow! That's great news. I'm looking forward to it. My best wishes to the entire FlexiDot team.
Hello a.zielezinski, we just put forward FlexiDot v1.04 containing your suggested parameter -M/--mirror!
Thank you very much. This feature is very helpful. I'm already showing FlexiDot to my students.
This is a graphic formatting update introducing two parameters, one of them suggested here. Thank you a.zielezinski for your sharing your thoughts!
As always, code, examples and documentation are on github at https://github.com/molbio-dresden/flexidot!
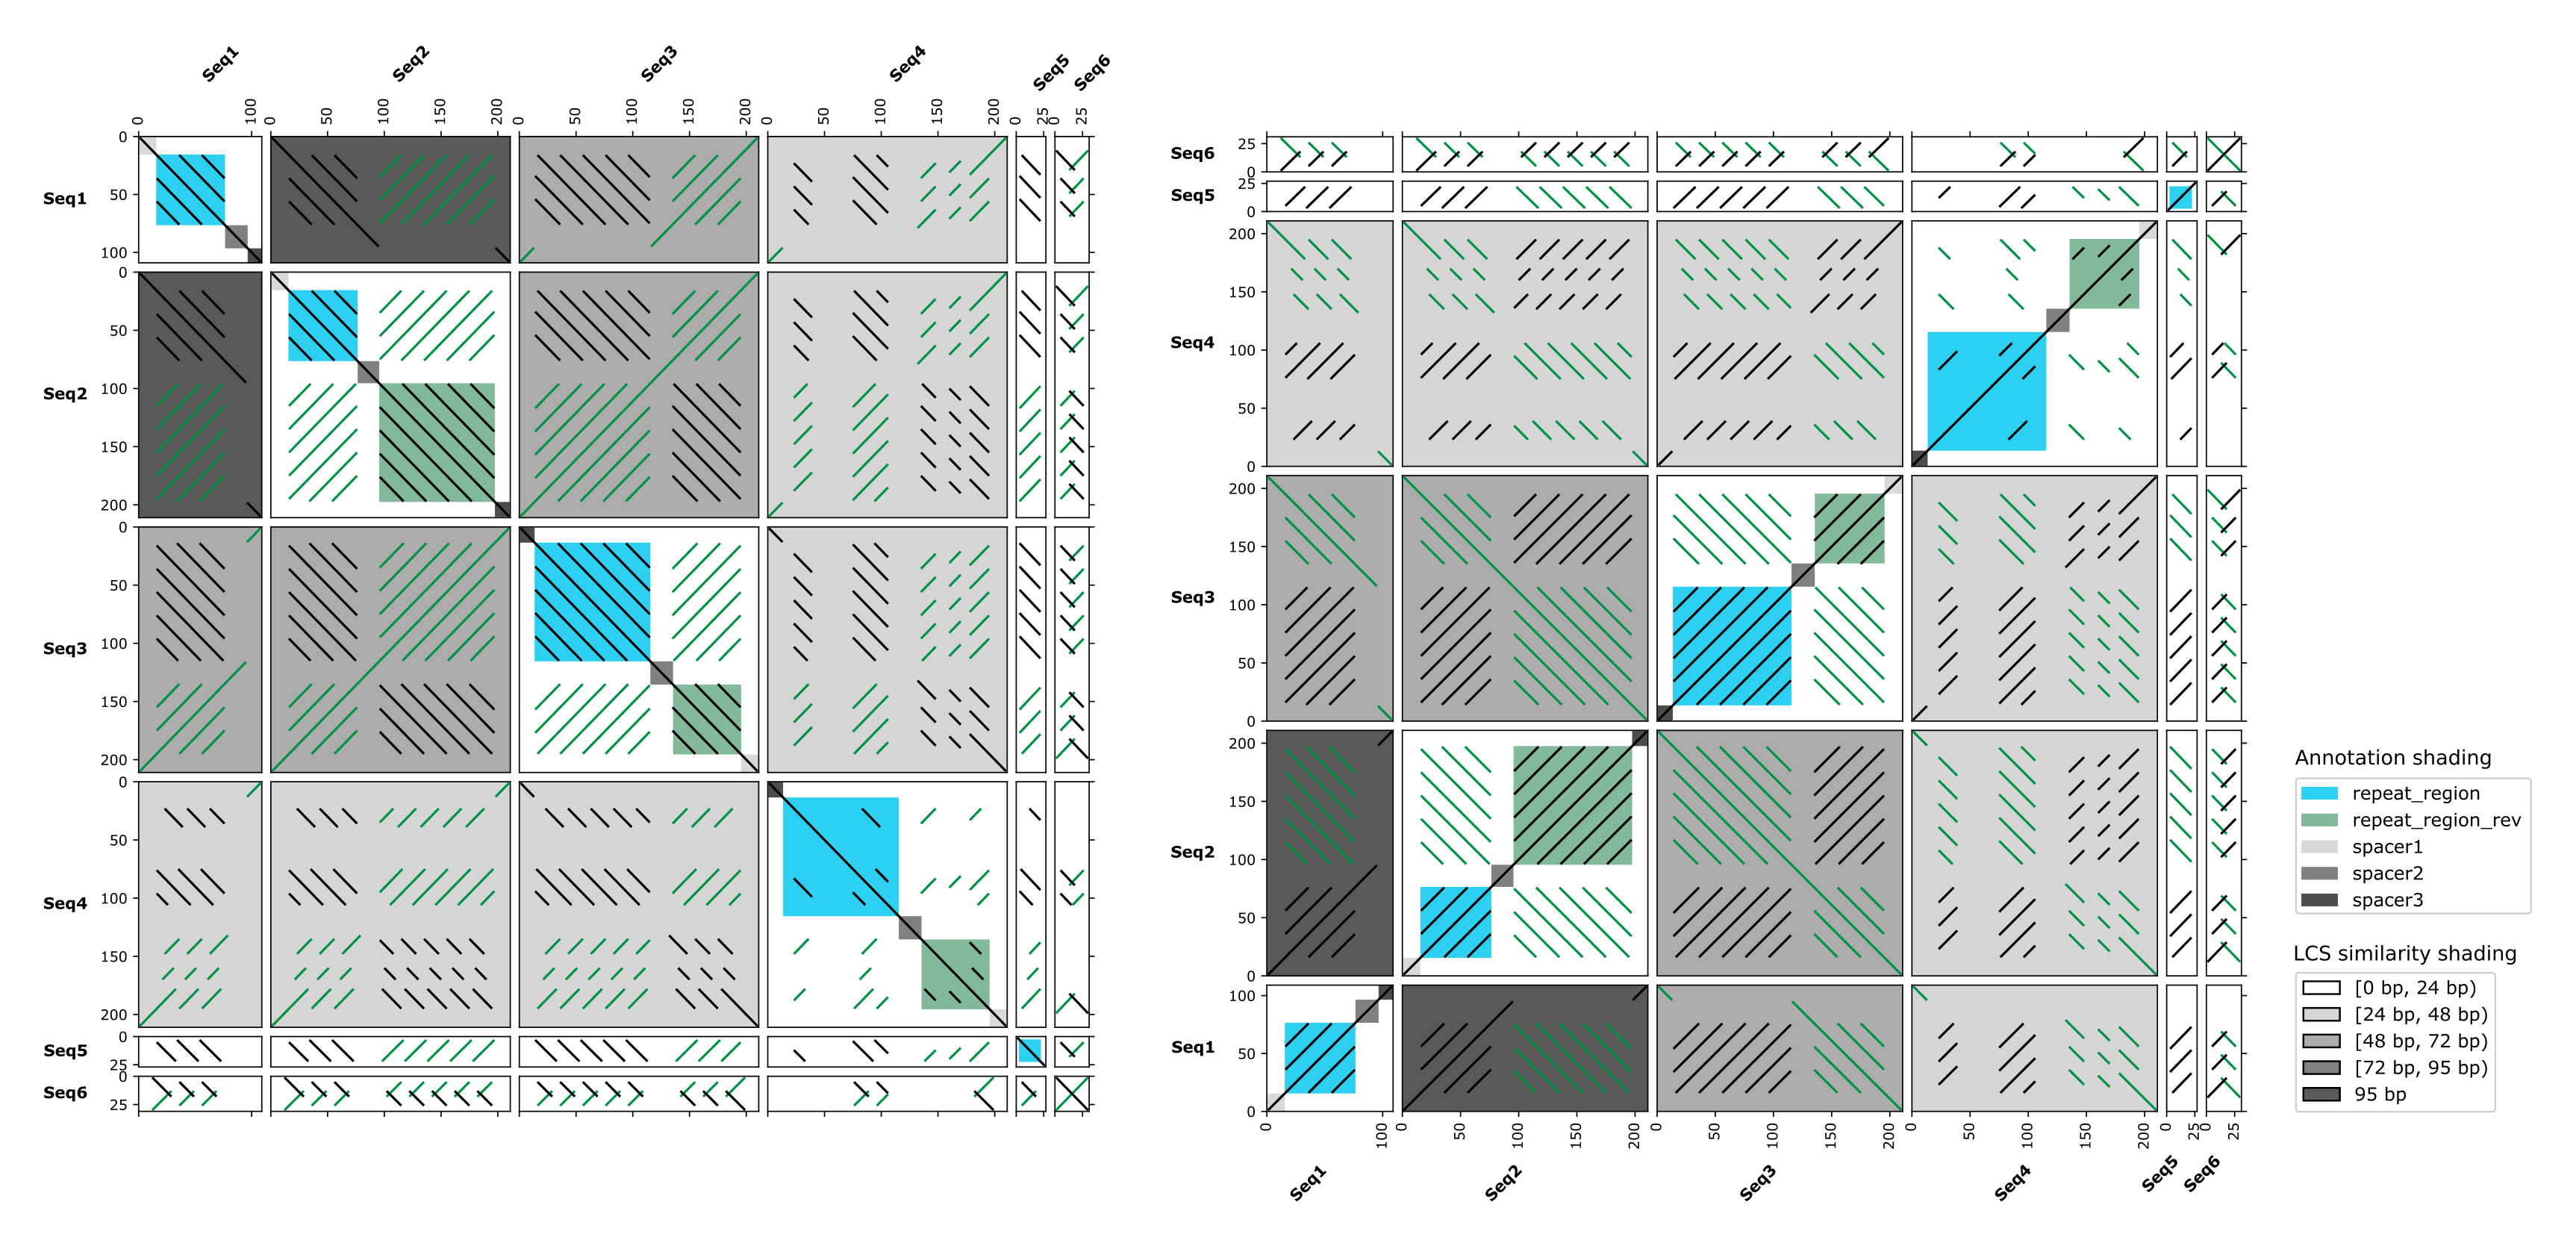
With -M/--mirror it is now possible to mirror the middle diagonal:
Basic commands:
python flexidot.py -i test-seqs.fas -p 2 -M n
python flexidot.py -i test-seqs.fas -p 2 -M y
Command plus aesthetics as shown here (as described in version update 1.03):
python flexidot.py -i test-seqs.fas -p 2 -M n -g example2.gff3 -G gff_color.config -x y -k 10 -F 0.06 -A 1.5
python flexidot.py -i test-seqs.fas -p 2 -M y -g example2.gff3 -G gff_color.config -x y -k 10 -F 0.06 -A 1.5
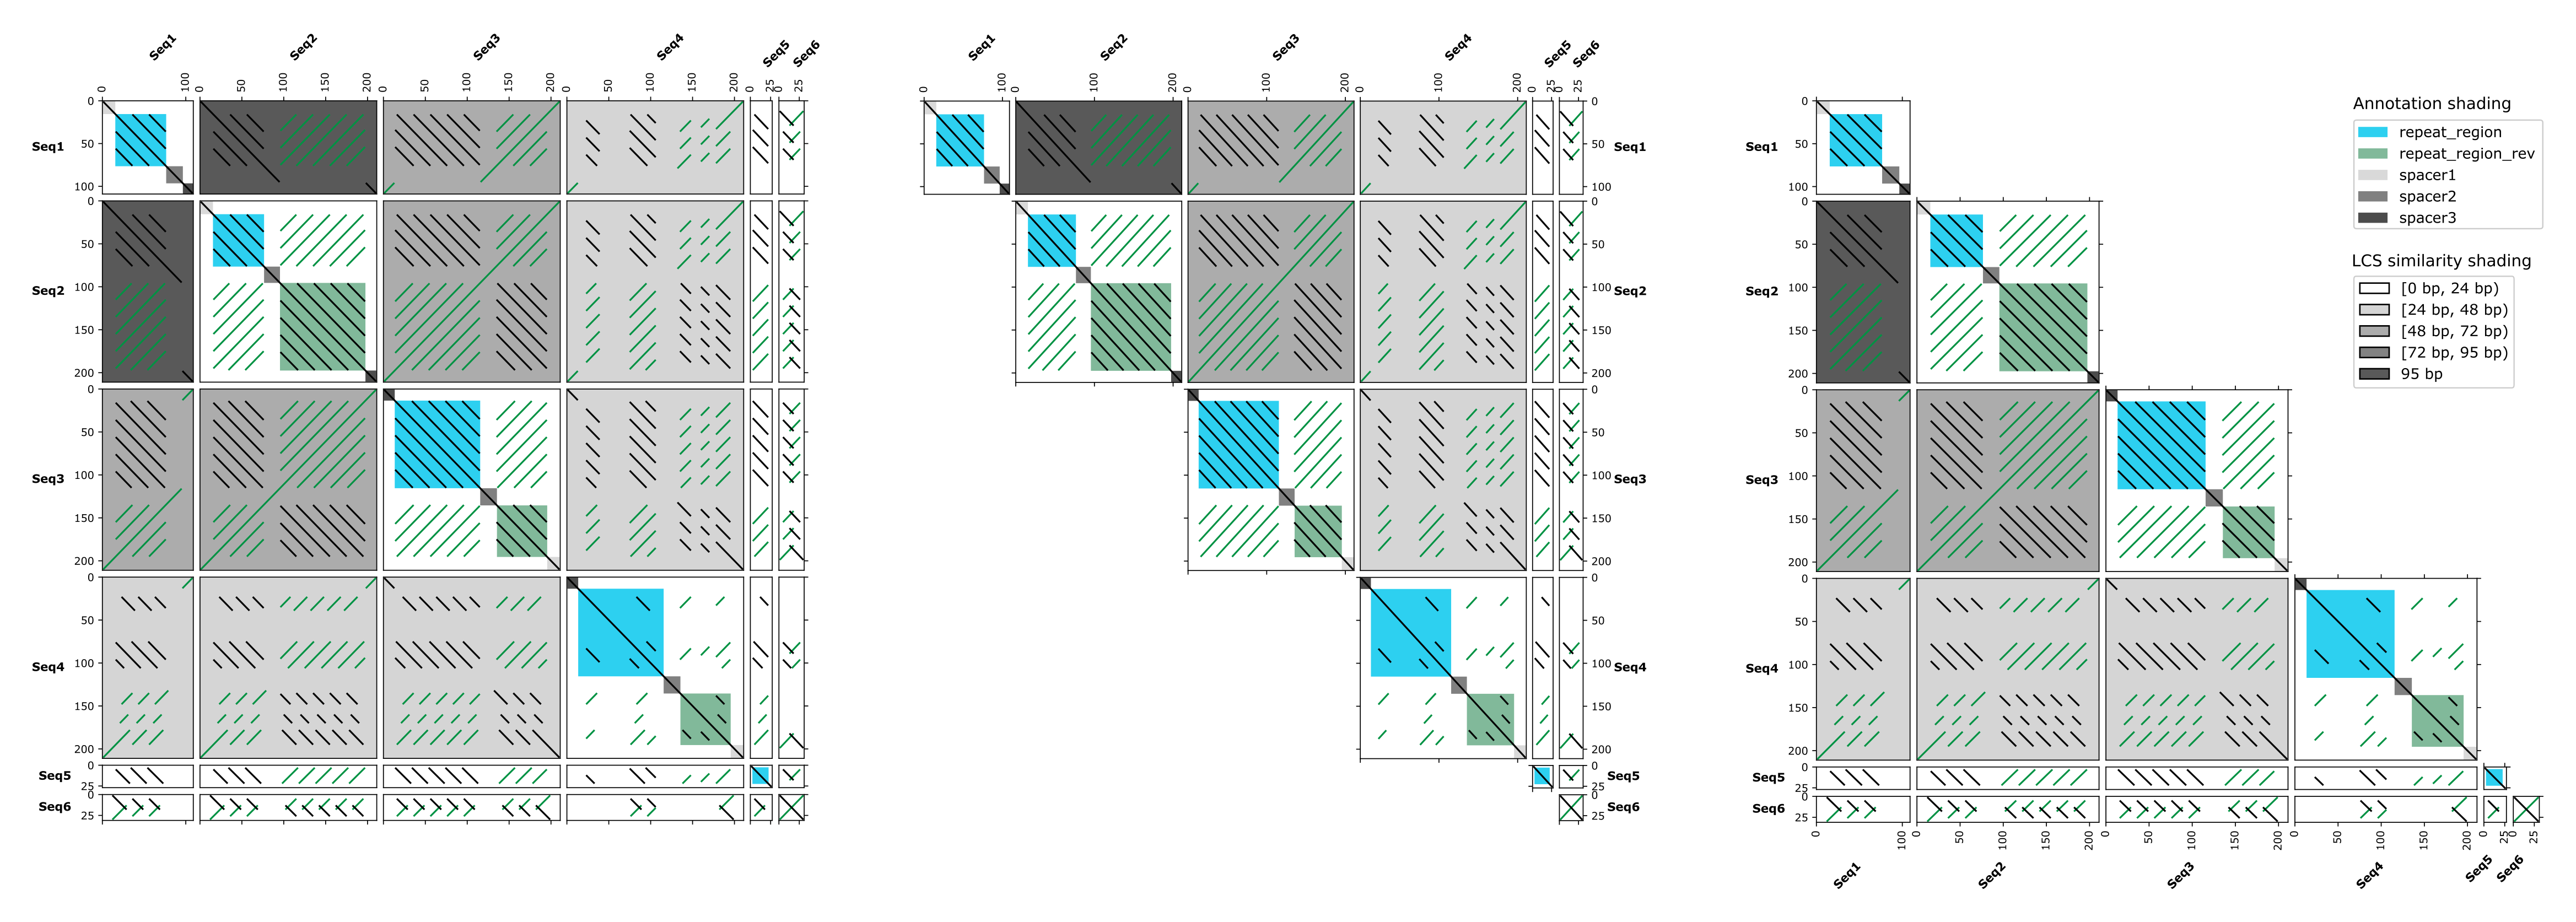
The -R/--representation parameter allows partial dotplotting, either printing the complete -R 0, the top -R 1, or the bottom dotplot -R 2:
Basic commands:
python flexidot.py -i test-seqs.fas -p 2 -R 0
python flexidot.py -i test-seqs.fas -p 2 -R 1
python flexidot.py -i test-seqs.fas -p 2 -R 2
Command plus aesthetics as shown here (as described in version update 1.03):
python flexidot.py -i test-seqs.fas -p 2 -R 0 -g example2.gff3 -G gff_color.config -x y -k 10 -F 0.06 -A 1.5
python flexidot.py -i test-seqs.fas -p 2 -R 1 -g example2.gff3 -G gff_color.config -x y -k 10 -F 0.06 -A 1.5
python flexidot.py -i test-seqs.fas -p 2 -R 2 -g example2.gff3 -G gff_color.config -x y -k 10 -F 0.06 -A 1.5
It is also possible to combine both parameters and to receive all kinds of dimensions... Happy dotplotting!
Log in to answer this question.