Bimodal p-value distribution
2
2
Entering edit mode
6.0 years ago
adamrork ▴ 30

Hi everyone,

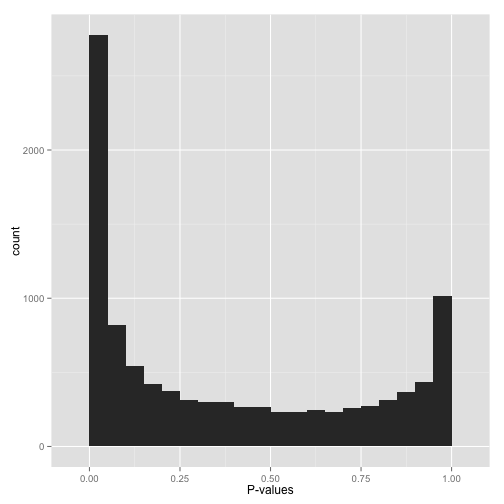
This is my first BioStars post, so please forgive me if anything about the question format is incorrect. I am analyzing a set of differentially expressed genes for GO category enrichment via GOseq. We conducted the differential expression analyses using Limma/Voom, and have one control group and an experimental group (3 replicates each). When I plot the p-values obtained from GOseq in R, I am obtaining a bimodal p-value distribution similar to the one shown in the attached figure. This is what I would intuitively expect, namely that some GO categories are significantly enriched (left side of plot) and others are definitely not, etc. (right side of plot). I looked up a few cases for the categories that had p-values in the 0.9-"1.0" range, and often times they only had one to a few differentially expressed gene out of hundreds or thousands of genes with that go category, etc.

However, now I'm at the point where I want to correct for multiple hypothesis testing using the Benjamini-Hochberg procedure, and have read that one should proceed with caution if the histogram doesn't follow the general monomodal "L-shape" showing an otherwise uniform distribution of the null p-values with a higher density of p-values near 0.0-0.05. Since mine is displaying a bimodal "U-shape" with p-value densities near 0.0 and 1.0, I figured that it would be best to get advice before going further.

I was wondering if there is a best next-step to take as far as my scenario is concerned, be it a correction method that doesn't assume uniformity near 1.0, etc.? I'm not incredibly experienced in this specific area, so if I can provide any more information, please let me know.

EDIT: I also realize now that an alternative solution to this problem is just to lower my α from 0.05 to 0.01, or lower. Across ~3000 tests, that lowers the proportion of false discoveries to 30 or fewer rather than 150, which I think seems more reasonable.

Figure by David Robinson, VarianceExplained.org

p-value distribution similar to my case

RNA-Seq GOseq p-values multiple-hypothesis testing • 4.5k views
ADD COMMENT
0
Entering edit mode

Hi, A nice explanation is given here http://varianceexplained.org/statistics/interpreting-pvalue-histogram/ . The right side could be due to lack of data. Having a cutoff before testing (like minimum number of reads could help) .

ADD REPLY
0
Entering edit mode

Hi microfuge,

That article is actually how I realized that this non-uniform distribution was an issue. I think that applying a correction when the values are non-uniform just makes the estimate more conservative from what I've read and simulated in R. Given that I'm comparatively okay with more Type-II errors compared to the same number of Type-I errors, I'll probably apply the methods as is since I don't want to do too much a posteriori database cleanup if possible.

ADD REPLY
0
Entering edit mode

Oh Sorry. I posted in a hurry and missed the last line specifying the image source. Makes sense.

ADD REPLY
1
Entering edit mode

No problem! That was actually one of the only websites that I could find that goes into any real detail on this issue. It kind of makes me concerned for everyone who has corrected a set of p-values for multiple hypothesis testing without checking the histogram.

ADD REPLY
1
Entering edit mode
6.0 years ago

Not really answering your question just a couple of thoughts...

  • This article has some comments about the shape of the p-value distribution inspection-and-correction-of-pvalues in case you haven't seen it before.

  • Just by looking at your histogram, I would guess the GO categories at the far left of the histogram have a p-value sufficiently small to "survive" a reasonable deviation from assumptions behind FDR and the procedure you used to extract them. So, assuming you are interested in top few tens most differential categories you should be fine with any sensible strategy. (Of course, this is a hand-waving suggestion and I think you are right raising the question).

ADD COMMENT
0
Entering edit mode

After having read more about it, I think that applying Benjamini & Hochberg in this case would just make the method more conservative than it would be otherwise based on why the null assumption is important. It seems like having a peak near 1.0 pushes the value of π0 up, which reduces the number of Type I errors even more (albeit at the expense of Type-II errors, which I'm comparatively fine with). Thank you for the article, by the way! I haven't seen that one yet.

Best,

Adam

ADD REPLY
1
Entering edit mode
2.4 years ago
izmirlig ▴ 10

Am I correct in understanding that you want to avoid calling significant the tests with p-values from the mode among the larger p-values? If so then consider replacing the BH-FDR procedure with a step-down procedure

First, suppose psi_m(i, delta) is some criterion function which is increasing, takes the value 1/m at i=1 and the value 1 at i=m. BH-FDR uses the criterion function i/m . The extra parameter, delta, is missing from the BH-FDR procedure but its meaning will become clear below.

A step-down procedure, using criterion function psi_m, is defined by the following expression for the number of significant calls

[***]   R = inf{ i : P_(i:m)  >  psi_m(i, delta) alpha } - 1

and the particular test statistics called significant are the indexes (i:m) corresponding to the ordinals 1 <= i <= R

Contrast this to the step-up procedure, which results the following number of significant calls

R' = max{ i : P_(i:m) <= psi_m(i, delta) alpha } (note that for psi_m(i,delta) = i/m this is the BH-FDR procedure)

NOTE: for a given criterion function, psi_m, the step-down procedure is always more conservative than the step-up procedure.

A nice step-down procedure which actually controls the FDX (probability that the FDP exceeds a given value) is one due to Lehman and Romano defined by applying formula [***] above, with

psi_m(i, delta) = (floor(i delta) + 1)/(m + floor(i delta) + 1 - i)

This guarantees that

P( V/R > delta ) < alpha

and will result, for sufficiently small alpha, in calling significant only test statistics corresponding to p-values from the mode to the left. A reasonable choice for delta would be delta = alpha

My R-package, pwrFDR, has relevant tools for applying the Romano procedure as well as tools for deriving sample size and power (determined via average power or via the TPX) https://cran.r-project.org/package=pwrFDR

ADD COMMENT

Login before adding your answer.

Traffic: 2633 users visited in the last hour
Help About
FAQ
Access RSS
API
Stats

Use of this site constitutes acceptance of our User Agreement and Privacy Policy.

Powered by the version 2.3.6