pheatmap: how to use legend information as row annotation?
I am using below code in pheatmap to generate the first heatmap.
oz <- DESeq(oz)
rld <- rlog(oz)
topVarGenes <- head(order(rowVars(assay(rld)), decreasing = TRUE), 35)
mat  <- assay(rld)[topVarGenes, ]
mat  <- mat - rowMeans(mat)
anno_col <- as.data.frame(colData(rld)[, c("time","treatment")])
anno_row <- data.frame(category = c(rep("pathway_1", 8),
rep("CATEGORY_2", 2), rep("pathway_3", 10),
rep("CATEGORY_4", 4), rep("limited_5", 11)), stringsAsFactors = FALSE)
mixed_name <- cbind(mat[,0],anno_row)
pheatmap(mat, annotation_col = anno_col, annotation_row = mixed_name, scale = "column",
cluster_cols = F, cluster_rows= F, clustering_distance_rows = "correlation",
clustering_distance_cols = "correlation", clustering_method = "average",
gaps_row=c(8,10,20,24),
cellheight = 6, cellwidth = 10, border_color=NA, fontsize_row = 6)
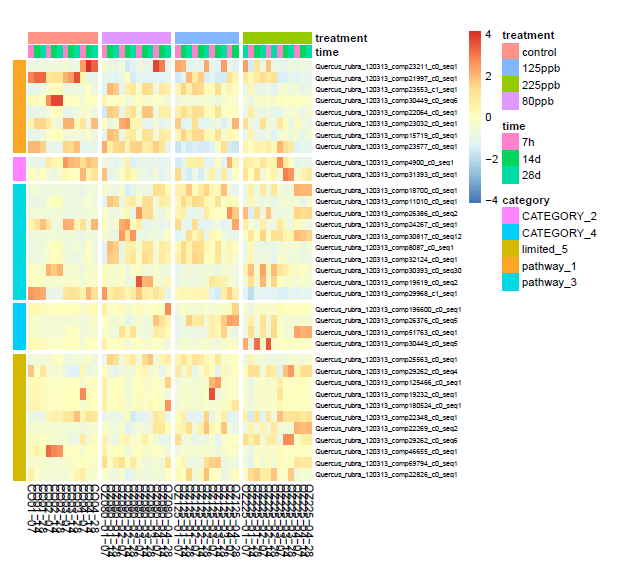
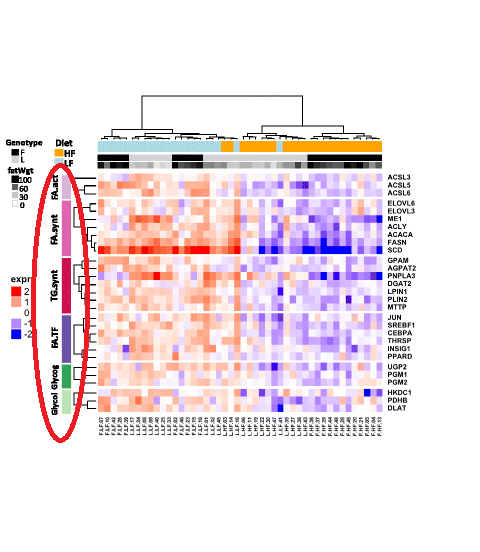
Now, my question is that what should be added to the above code to have the "category" legend on the left of the heatmap and close to each category color, like the second figure that I have highlighted in red.
In advance, thanks for your helps!
• 19,030 views
•
link
0 answers
No answers yet.
Log in to answer this question.
Have you tried
annotation_name_row=T? I think the legend position is an open issue.Yes, I did. But nothing has changed.
You may want to take a look at the ComplexHeatmap package, with which you can definitely change the position of the legends and legend text.
I think you are right! The only way is switching to ComplexHeatmap package! Thank you!
Yes, it will take 1 day to switch, if you have that time. However, once you move, you will never return to the other heatmap functions. The vignettes for ComplexHeatmap are very good.