Modifications of graphs from Sleuth Object?
Dear Biostar users,
I have been using Kallisto/Sleuth to analyze my RNA-seq data and have a couple of questions related to the modification of heat maps based on a sleuth object (so), that I hope someone can help me with:
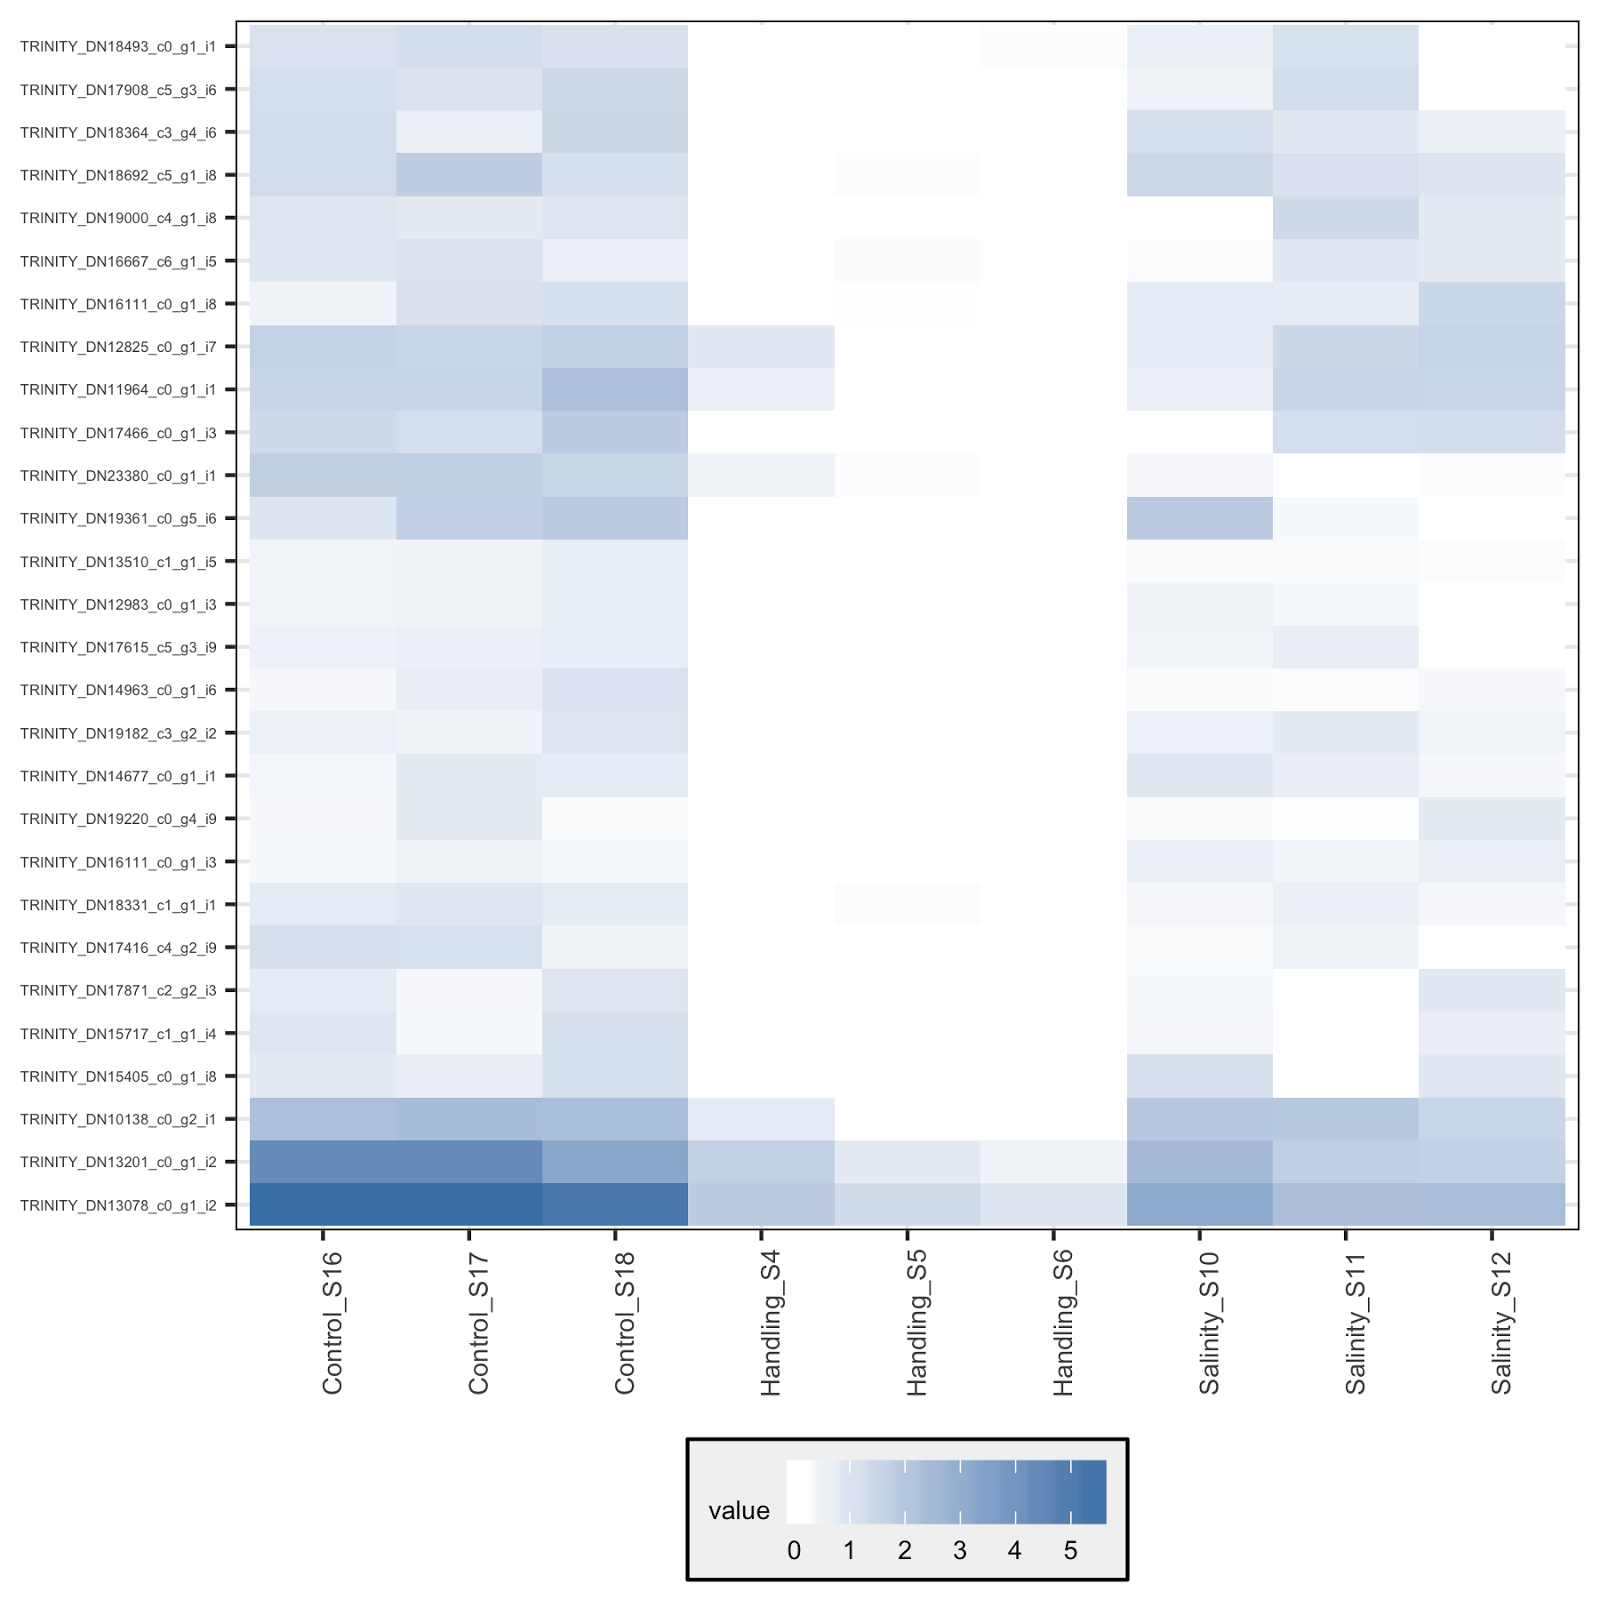
Question 1: I am a bit puzzled about what the "value" that goes from 0-6ish represents (see below) - what exactly does that mean? Is there a way to further modify the R-code below in order to get up- and down-regulation (minus - plus values) represented instead?
Question 2: How to modify the R-code further to add a dendrogram to the heatmap?
Thanks, Birgitte
The modified heat-map R-code:
plot_transcript_heatmap(so,Handling_type3$target_id,units = "tpm",trans = "log", offset = 1) +
scale_fill_gradient(low="white",high="steelblue", guide=guide_colorbar(direction="horizontal")) +
theme(axis.text.y=element_text(size=4),
    axis.text.x = element_text(size=7),
    legend.position = "bottom",
    legend.text = element_text(size=7),
    legend.title = element_text(size=7))
The resulting plot:
• 3,321 views
•
link
0 answers
No answers yet.
Log in to answer this question.