This is a test version of Biostars. For the public version, visit https://www.biostars.org.
FastQC: 'Per base sequence content' for RNA-Seq

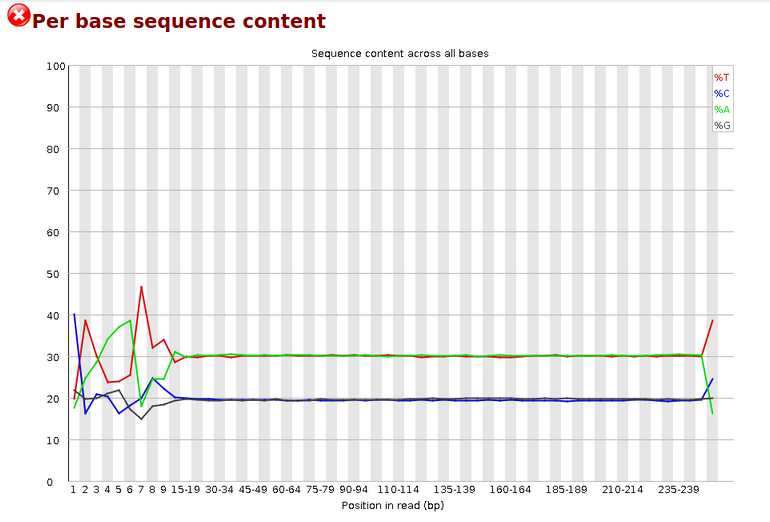
Going through my RNA-seq samples, I've noticed this weird pattern for 'per base sequence content' graph.

http://imgur.com/bhYIVJT

There is a lot of noise in the first few base pairs and I was curious what it is and if I should be concerned for not reducing the noise before alignment.

rna-seq

1 answer

Here is a link (for a post by Dr. Simon Andrews, author of FastQC) to put this topic to rest. Short answer: Nothing to worry about or mitigate.

@genomax, so the per base sequence content curves are supposed to be quite close to one another right? What if there is a significant separation between the lines?

Can you show an example of what you have?

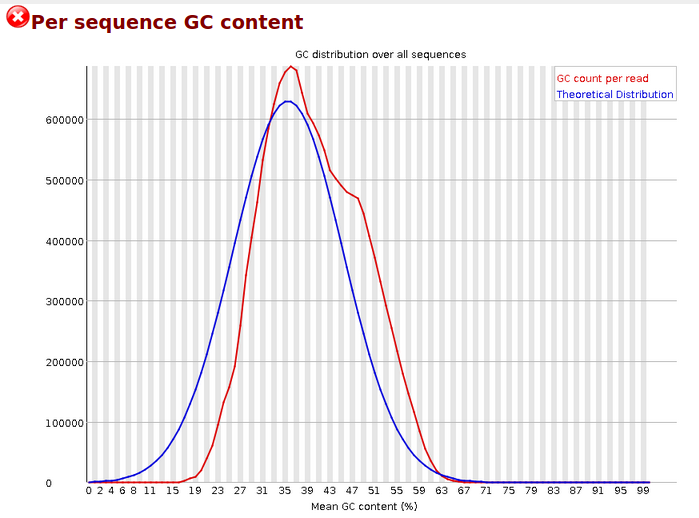
If your RNA was prepared by poly-A capture/enrichment then an AT bias can exist. What does the GC content plot look like?

I think it was poly-A indeed (I still don't know for certain, to be honest). Here's the GC content plot. That one looks fine to me (apart from that bit of a shoulder).

Log in to answer this question.