Thank you! So where should I put the vector colors? I'm a newbie, so please bear with me...
• 0 views
•
link
Hi
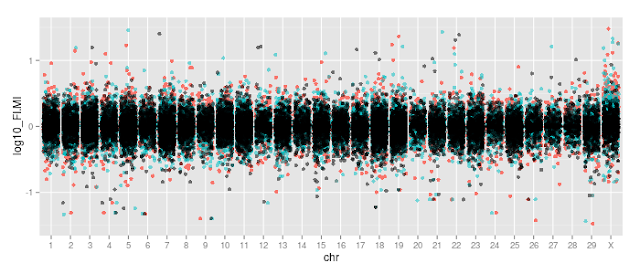
I made a jitter plots with 3 data set overlaied in a single plot. What I tried to do was setting each data different colors, but the colors weren't changed right. The colors seemed to be automatically assigned to each data set. Does anyone know the reason here?
Here's the R code
ggplot(
  All,
  aes(
    x=chr,y=log10_FI.MI)
  ) + guides(colour=FALSE) +
ylim(c(-1.5,1.5)) +
geom_jitter(
  alpha=1,
  size=2,
  position=position_jitter(width=0.4),
  aes(color="blue")
) +
geom_jitter(
  data=All,
  aes(x=chr,y=log10_FN.MI,color="red"),
  alpha=0.5,
  size=2,
  position=position_jitter(width=0.4)
) +
geom_jitter(
  data=All,
  aes(x=chr,y=log10_MN.MI,color="grey"),
  alpha=0.5,
  size=2,
  position=position_jitter(width=0.4)
)
and the plot
Thank you!
Hi there,
I think you are not using ggplot2 as you have to. To represent data with ggplot2, you have to set your data to long format, it means all samples in the same data-frame. In your case, the data frame will be:
sample_name           chromosome             log10_FI.MI
sample1                   1                     -1
sample1                   2                     +1
....
sample2                   1                    -0.5
sample2                   2                    +0.24
....
sample3                   1                      +1
....
You see? Then, when you will plot your data, in "aes", you will choose color = sample_name if you want to attribute a color for each one. However, if you want your proper color, you can use a vector color = c("red", "blue", "green").
Thank you! So where should I put the vector colors? I'm a newbie, so please bear with me...
Log in to answer this question.