
Hi,
I was wondering whether there is a way in R to plot the genes in a genomic region in the same plot as a previously created regional Manhattan plot, in the way LocusZoom does, but I would like to create my own Manhattan plots above and then just add the gene plots. I have also been looking at GenomeGraphs but it doesn't seem like I can add the plots below my own plots, but maybe I am missing something.
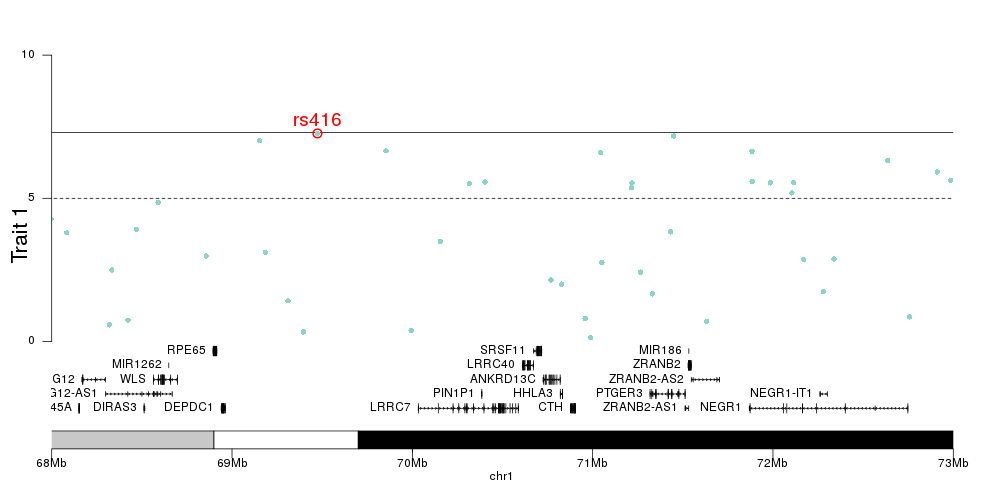
For example I have this regional plot of a chromosome, say chr 1 (This is all made up data)
pval<-runif(6000, 0, 1)
logPval<--log(pval,base=10)
pos=1:6000
rsID<-paste("rs",1:6000,sep="")
data<-as.data.frame(cbind(pos,rsID,pval,logPval))
plot(x=as.numeric(data$pos),y=as.numeric(as.character(data$logPval)))
And I would like to add at the bottom boxplots showing the genomic position of the following genes, so showing the range these genes span and the names of these genes on top of their non-overlapping boxes (just like in LocusZoom):
genes <- c( "NFIA", "KANK4", "DOCK7", "L1TD1")
gene.start<- c(4, 350, 1000, 2100)
gene.end<- c(3004, 3350, 4000, 5010)
genes.pos<- as.data.frame(cbind(genes, gene.start, gene.end))
Any help or suggestions are greatly appreciated!
Thank you! Fra


Hi Leonor, thank you for your reply. I have seen these posts before, but it is not really what I am looking for. I would really like something like this: http://genome.sph.umich.edu/wiki/LocusZoom_Standalone But with my own plots above having the same genomic range as the plot with the gene positions and their length.
From your link, I see that LocusZoom uses R to generate these plots using an add-hoc 'locuszoom.R' script. Have you tried using this script? LocusZoom is quite large, so I haven't tried it myself.
Yes I have tried, but it also plots the regional Manhattan plot, while I have my own plots that I would like to use...
I think this is just an R question, which I would be happy to solve if you could post an example (small drawing) of what your are trying to achieve compared to what LocusZoom gives you.
Yes! you are right! I guess it all comes down to figuring out how to draw the horizontal boxplots in a way that they are not superimposed since I have the positions of the genes in the genomic range...
Could you draw us an example of what you want to plot (edit your question to add it)?
I have edited my question to add a solution.
Thank you very much! This looks prettier that what I had come up with! I tried a loop with 'rect' and horizontal boxplots: neither have given me satisfying results, thank you!
You can then tick this as an answer, if the answer suits you. If you are looking for help on R graphics, I point you to here, where you will found very nice figures with the code to produce them : http://addictedtor.free.fr/graphiques/
The only thing is I can't get the 'polygon' function to work even if I am specifying all as.numeric... (The only difference with my real dataset is that I have all the gene info (gene.start, gene.end, and genes names) in one data frame...There is no error message, but just it ignores the arrow... Thanks again!!
as.numeric(as.character()) should work. Factors are not translated into numerics the way we expect, but rather as 1, 2, 3, 4..
The start and end positions are integers and the names are characters, can't get it to add the arrows to the genes, anyway the rest works great, thanks again
Which arrows? The genes are already represented as rectangular arrows...
Just getting rectangular boxes instead of rectangular arrows...
You should change the parameter length (say to 1000 or 10000), it's the size of the arrow on the figure (otherwise it is crunched and you don't see it).
…changing the 'length' when I use the function doesn't do it, maybe changing the parameters in the definition of the function 'rectarrows', sorry for the misunderstandings...
I don't understand your specific problem, so I can't help you more. I've edited my answer to add some details.