QC of Oxford Nanopore fastq files with NanoPlot
1
1
Entering edit mode
4.9 years ago
s.m.frampton ▴ 20

Hello,

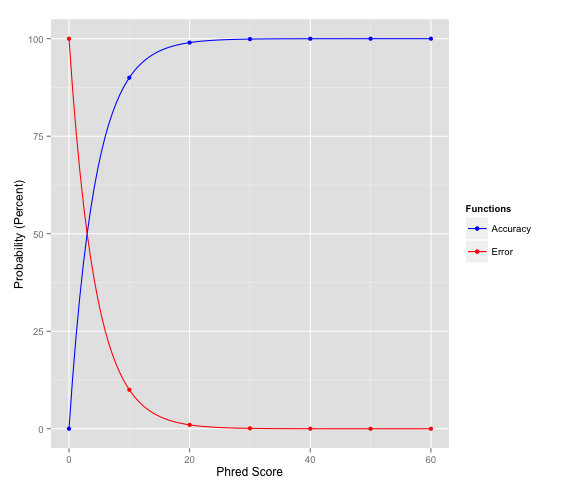
I am very new to the world of sequencing and would really appreciate your knowledge. I am trying to study a genomic region containing 5 very homologous genes and have obtained the FastQ files generated using MinION. I used the tool NanoPlot to produce a QC report but am struggling in understanding it. Particularly regarding the quality scores and quality cut-offs; I appreciate a quality threshold depends upon my application but would it be possible to explain very simply what the number of the 'mean read quality' actually represents? If I go on to filter my reads, is there a standard cut-off for ONT data?

Any information around this would be extremely helpful!

Oxford-Nanopore long-reads • 11k views
ADD COMMENT
1
Entering edit mode

Wikipedia is also not bad here, but it might be tricky to find the right page.

https://en.wikipedia.org/wiki/FASTQ_format

A rough estimated might by PHRED quality scores of ~8-12 for raw nanopore reads and ~30-35 for illumina reads.

ADD REPLY
0
Entering edit mode

Hello!

I have obtained a 'Median read quality' value of 9.4 for a metagenomic sample through Nanoplot analysis. Is there any mathematical formula for converting this value to a Phred score?

Regards

ADD REPLY
1
Entering edit mode

9.4 is the phred score

ADD REPLY
0
Entering edit mode

Thanks a lot, sir!

Here is a snapshot of another part of my NanoPlot result:

Number, percentage and megabases of reads above quality cutoffs

Q5: 40300 (100.0%) 124.3Mb Q7: 40155 (99.6%) 124.1Mb Q10: 13706 (34.0%) 38.0Mb Q12: 956 (2.4%) 1.9Mb Q15: 4 (0.0%) 0.0Mb

Please suggest:

  1. Does this mean that 40155 (i.e., 99.6%) of my reads are having an average Phred score of 7 (Q7)?
  2. If so, then is the metagenomic sample reads eligible/ any good for further processing?

Thanks and Regards

ADD REPLY
4
Entering edit mode
4.9 years ago

TLDR: if you can align the reads (i.e. if you have a reference genome) then you might want to filter on mapping quality, and not on read accuracy.

In NanoPlot, the mean read quality is the mean of the base call quality scores. To be entirely correct, those (Phred scale) base call quality scores are first converted to their probability of being correct, averaged, and then back to the Phred scale. A bit more about that can be found in this blog post.

ONT will by default filter on a minimal quality score of 7, but that's quite arbitrary. I don't know why they went with that score. For my applications, which is structural variant detection, I don't filter at all. If I get a low-quality read, which does map reliably, and identifies a variant then I'm happy. The quality scores match quite well with the percent identity if your data is recent at least. So as such, you can estimate the error rate of a read, based on the quality score. A quality score of 7 corresponds with a ~80% accurate reads, which is not amazing. See also the image below for how the Phred score corresponds to the probability of error or the accuracy:

enter image description here

For your application I would let the aligner judge reads: if it aligns with a high mapping quality to one of those genes, and not to the others, then that's a good thing right? I don't know how similar the genes are, and how long your reads, though, and also not what your aim is.

ADD COMMENT

Login before adding your answer.

Traffic: 2452 users visited in the last hour
Help About
FAQ
Access RSS
API
Stats

Use of this site constitutes acceptance of our User Agreement and Privacy Policy.

Powered by the version 2.3.6