Forum:Calling Single-Barcode Samples from Mixed Runs as Dual-Barcode Samples | Possible Illumina Run QC Flags?
5
5
Entering edit mode
5.0 years ago

We have noticed something that we thought other people might want to see (and possibly help provide some useful advice to us). This isn’t something that we plan to publish in a peer-reviewed publication, but I wanted to post it on Biostars because I thought it should be something less formal than a pre-print (even though I also believe Biostars discussions should sometimes be considered citable in peer-reviewed journal articles).

I am a Bioinformatics Specialist in the Integrative Genomics Core. So, I would argue my title as well as using bcl2fastq (with the --barcode-mismatches 0 parameter) and interop are main reasons for posting this here (in addition to being accessible to everybody and having a nice comment system).

Please click here to view a summary of some analysis with a subset of our runs in 2018 with mixes of different sample types (such as single-barcode, dual-barcode, and 10X Genomics samples), where we tested calling single-barcode samples as dual-barcode samples:

We happened to do this for one run, where we noticed 5-15% read loss with the dual-barcodes (I believe Jinhui Wang noticed this). Xiwei Wu then asked me to test with more runs (the median read loss was 15%, but you can see the variation per-sample on slide #7, in the PDF posted on GitHub).

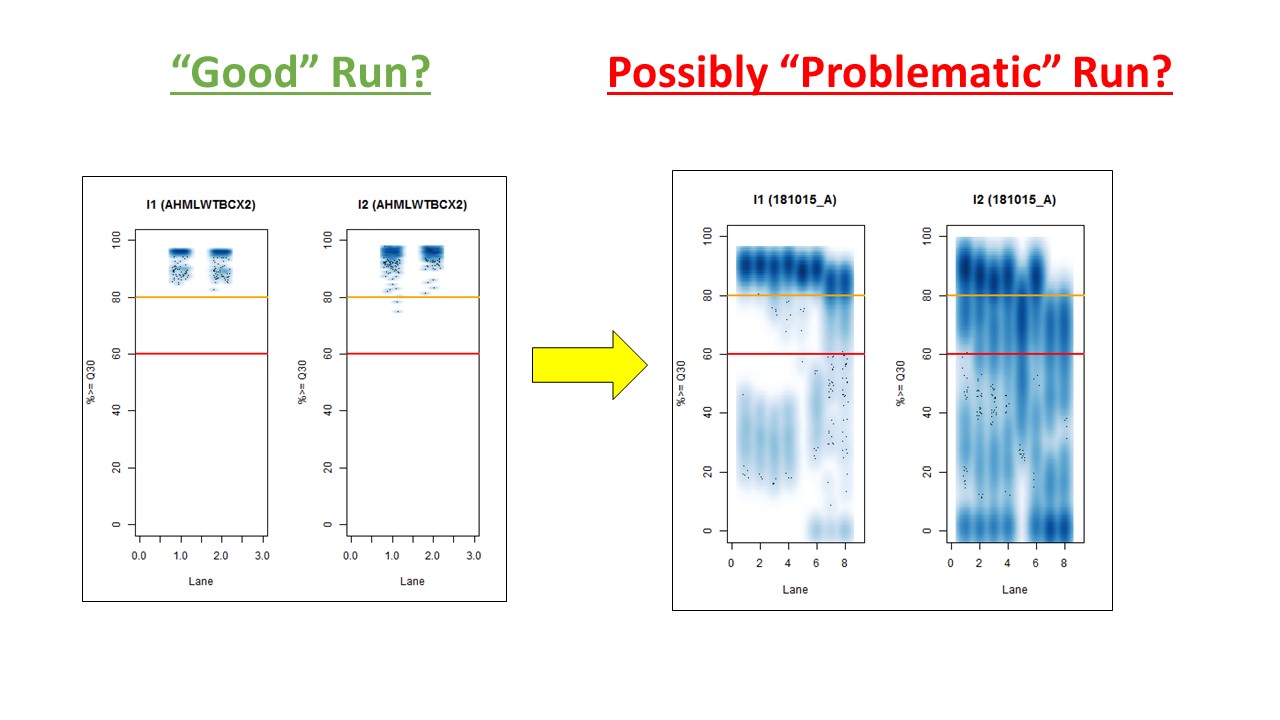
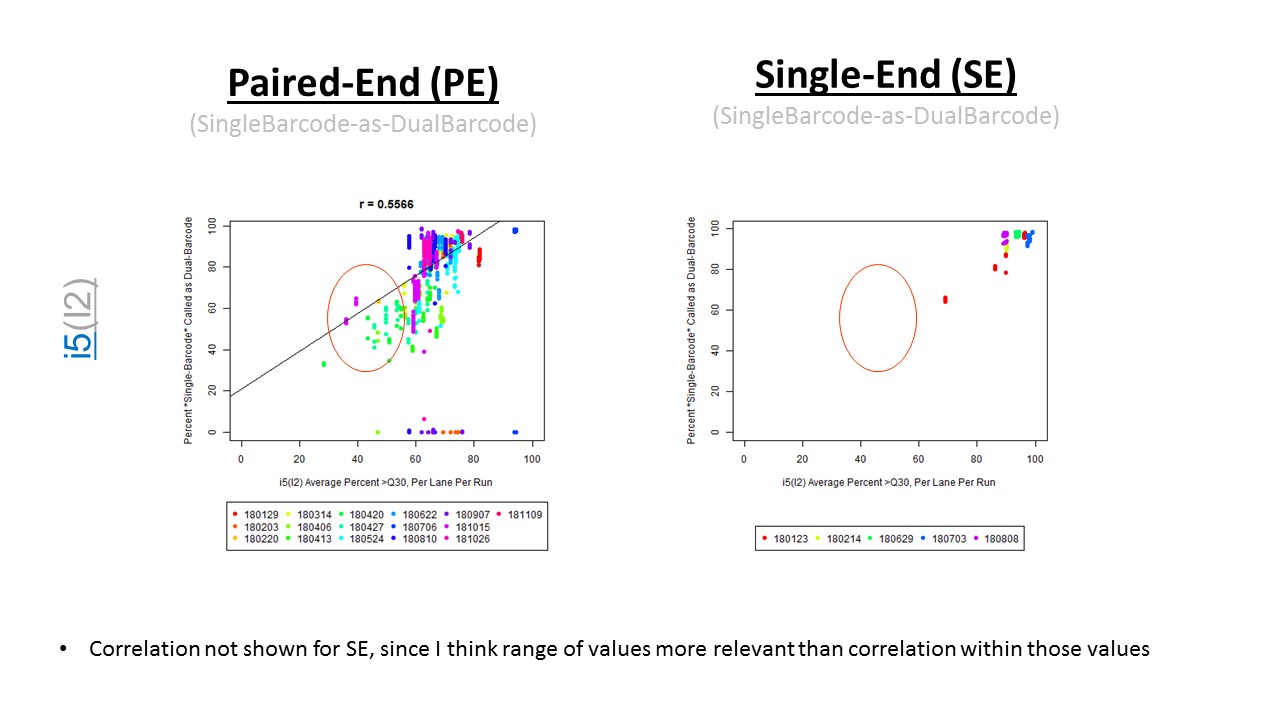
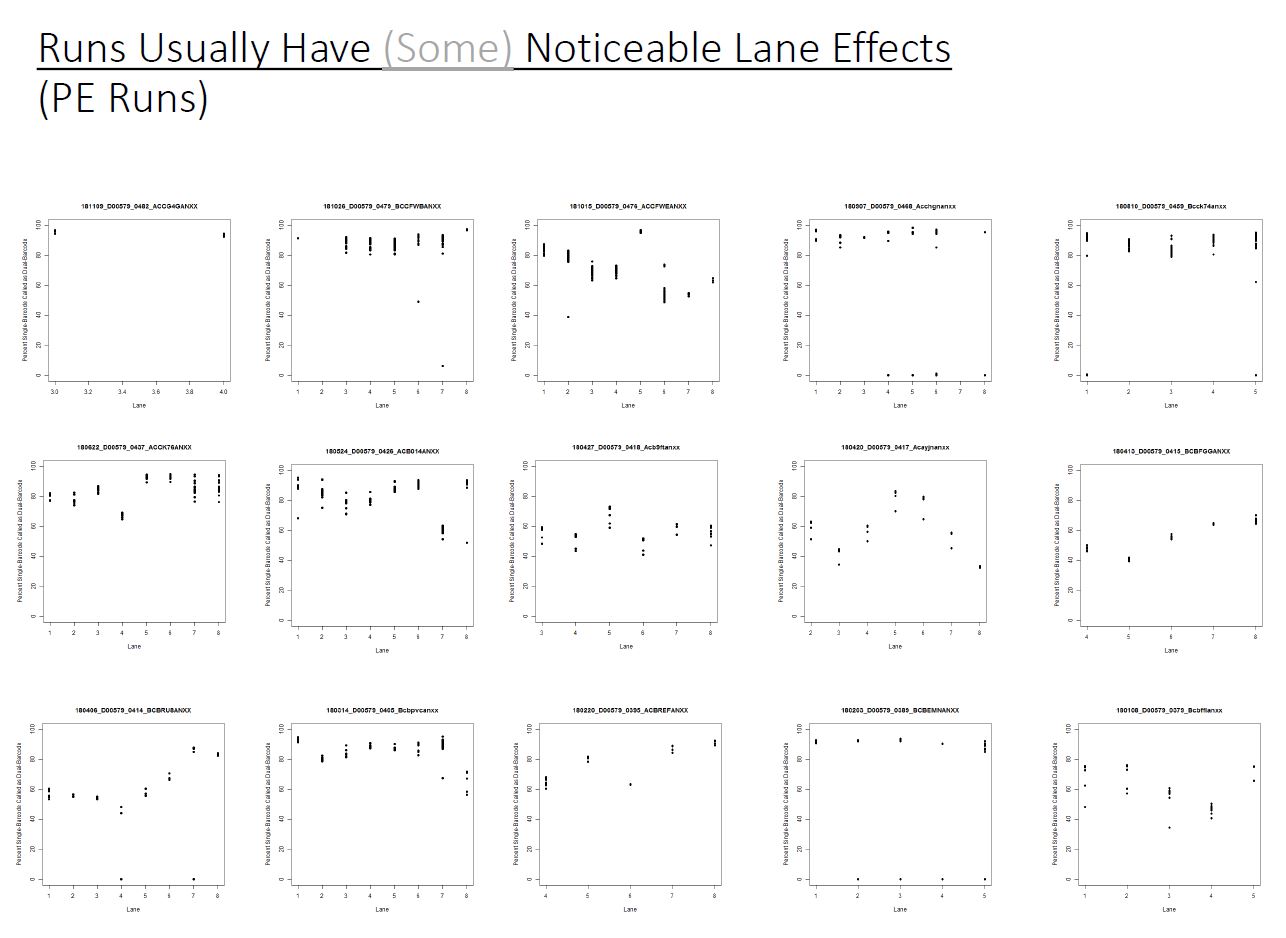
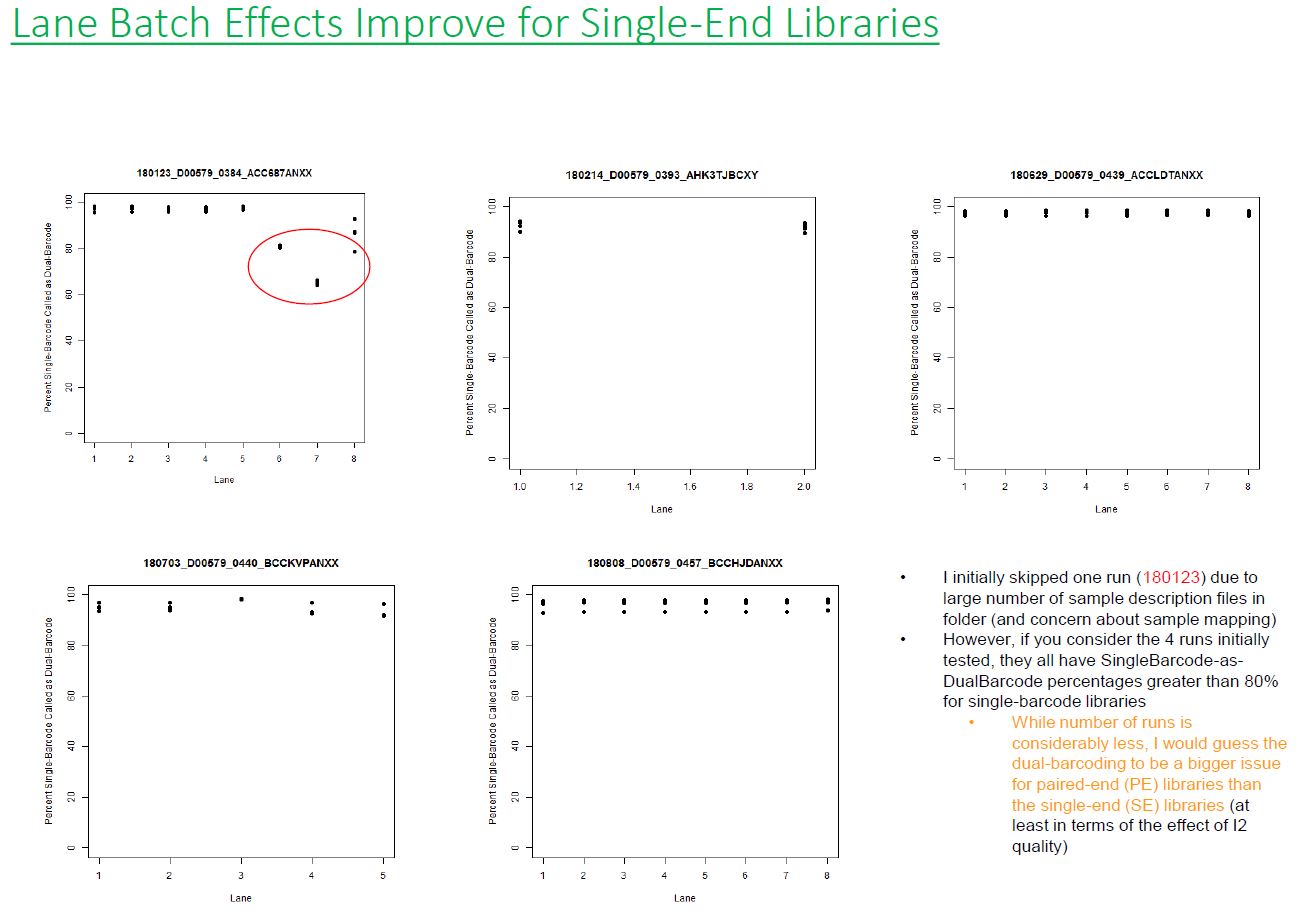
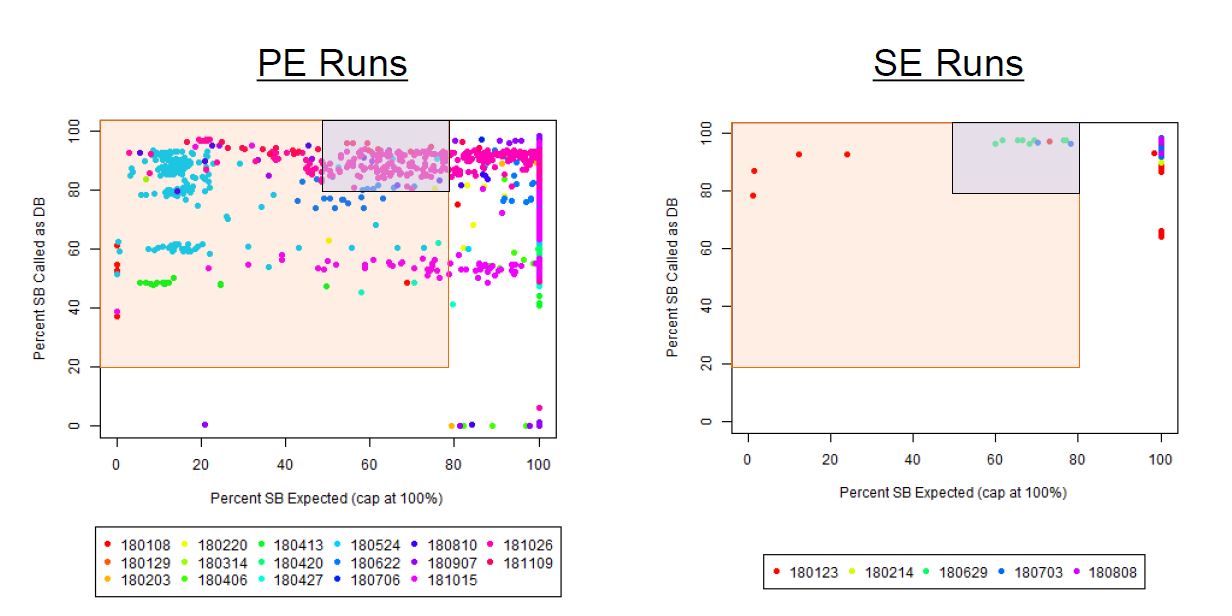
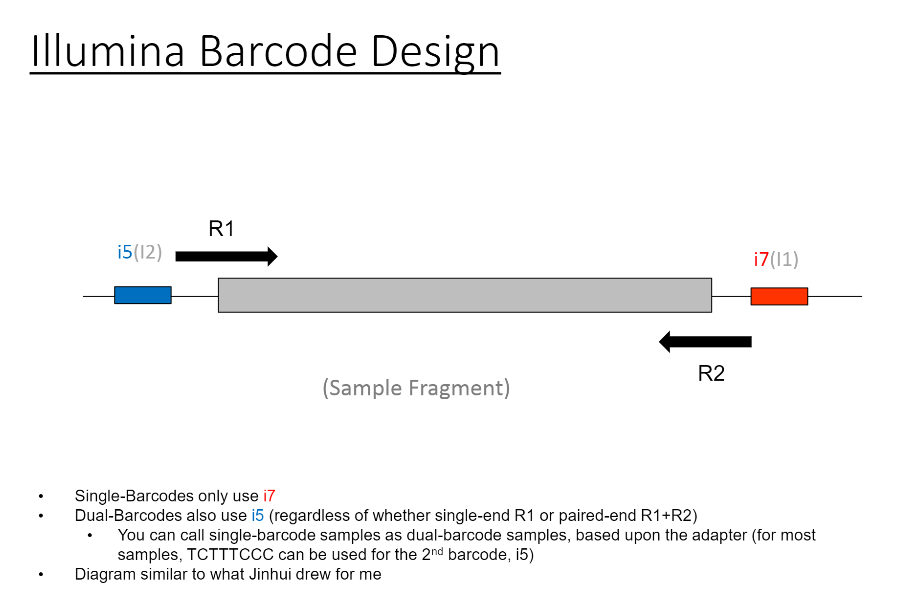
If we have the correct 2nd barcode (for otherwise single-barcode samples), the I2 quality scores (for the 2nd index, also called i5, see slide #2) affect the percent of reads kept for SingleBarcode-as-DualBarcode samples (slide #8). There is some tentative evidence that not having mixed barcode types within the 8 lanes of a HiSeq Regular Run (which is one reason why bcl2fastq has to be run for base calling) can help with the expected read percentages (slide #19, versus slides #16 and #18). There is also promising (but limited) evidence that the percent of reads lost in dual-barcode samples matters more for paired-end (PE) samples than single-end (SE) samples (slide #12-14 and #17). While some conclusions are hard to make with a limited number of runs, I believe these as quality flags may be useful for future runs:

a) >40% of samples have <50% Q30 I2 Reads

Drop in I2 >Q30 Associated with Read Loss

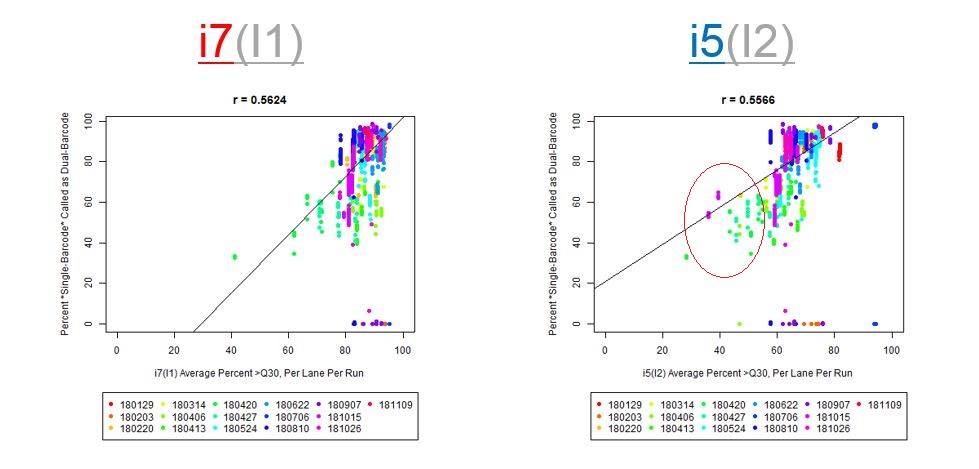
The Percent >Q30 Values were extracted from the InterOp binary files, after converting them to text files (the plot above is for single-barcode paired-end samples mixed with dual-barcode samples, showing lower I2 Q30 values noticeably decreases the percent of reads called for a single-barcode sample when treated as a dual-barcode sample). In terms of generating a table with those percent >Q30 values, the most relevant command would be:

/path/to/interop/build/src/apps/imaging_table .  > interop_imaging_table.txt

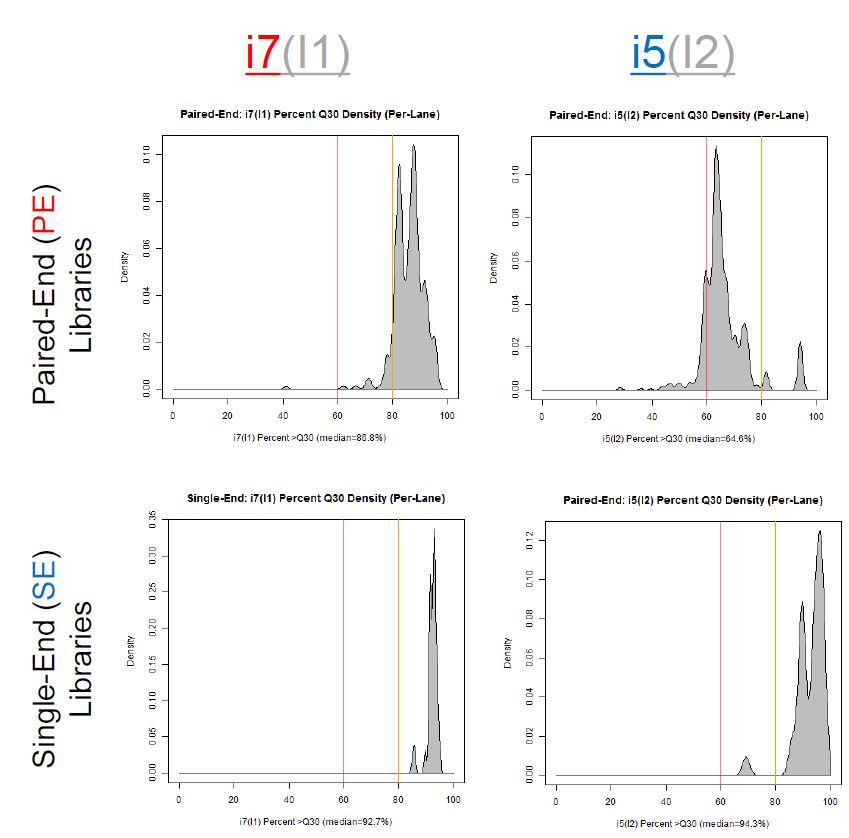
In other words, the plot above uses the average values, and the plot below provides examples of why I think showing the distribution of I2 Q30 values may be useful as a QC metric in future runs:

Q30 Distribution Per-Tile Per-Lane

While the precise metric and plot (see slide #9 versus #10) is a little different for quality flag a), the need to have >Q30 indices was mentioned in Wright and Vetsigian 2016.

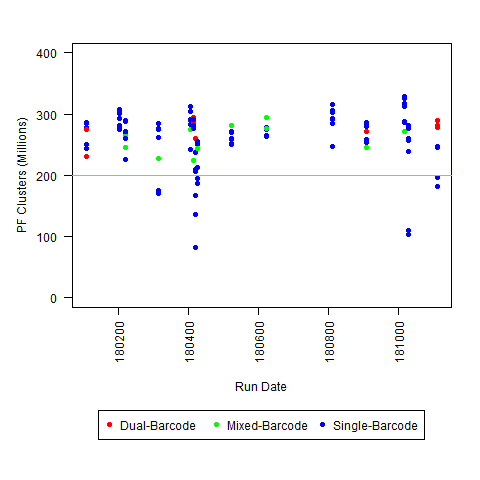
b) >50% of samples have less than the required number of reads (with threshold set below expected number of reads, expecting some loading variability)

c) <200M PF Clusters per lane (for Regular HiSeq run)

Total HiSeq 2500 PF Clusters Per-Lane

So, if you have any other similar observations, please leave a comment/answer! For example, these plots are all HiSeq 2500 runs (mostly Regular Run, with some Rapid Runs): we would be interested to know if this typical for that level of throughput (or if the severity of the I2 Q30 issue varies with overall throughput), and whether other people decided that any of the 3 criteria defined above was sufficient to define a run as “possibly problematic.”

Based upon feedback, I thought it might also be helpful to list relevant information that I think may help the discussion (if you are able to run a similar comparison; or, if you have other currently explained read loss):

1) Do you have Single-End (SE) or Paired-End (PE) samples (with at least some dual-barcoded samples)? I think the I2 Q30 values may be something more to watch on PE dual-barcoded runs than SE dual-barcoded runs.

2) What sort of sequencer are you using (MiSeq, HiSeq, NovaSeq, etc.)? Are you running it in any special mode (such as "Regular Run" versus "Rapid Run" for HiSeq)?

3) Do you have any runs with any of the following: drops in I2 Q30, large number of samples with insufficient reads, or total low PF cluster count? If so, do they seem to be associated with per-sample read loss (or anything else)?

I'm not sure what "Low" PF would be for all platforms (although I am saying <200 million reads is "low" for HiSeq 2500 regular run), so I you may have to use some of your other experience for that one.

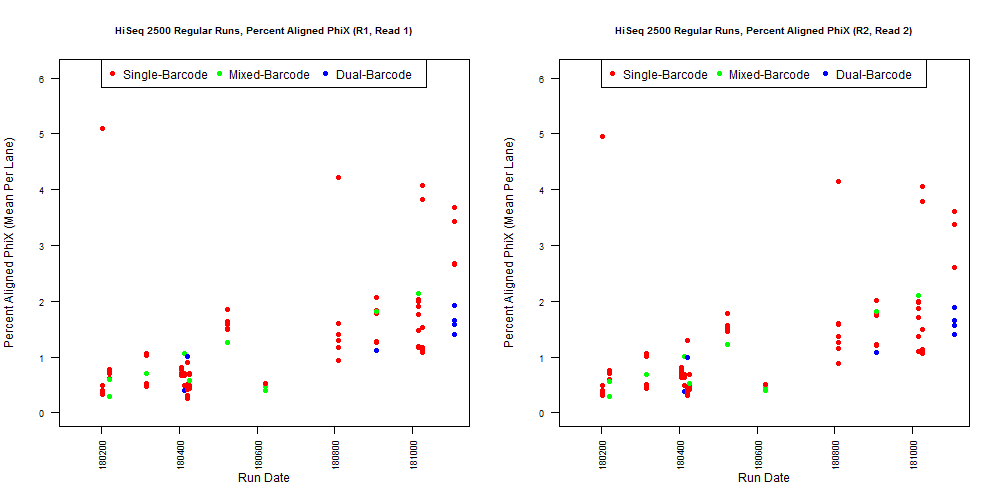
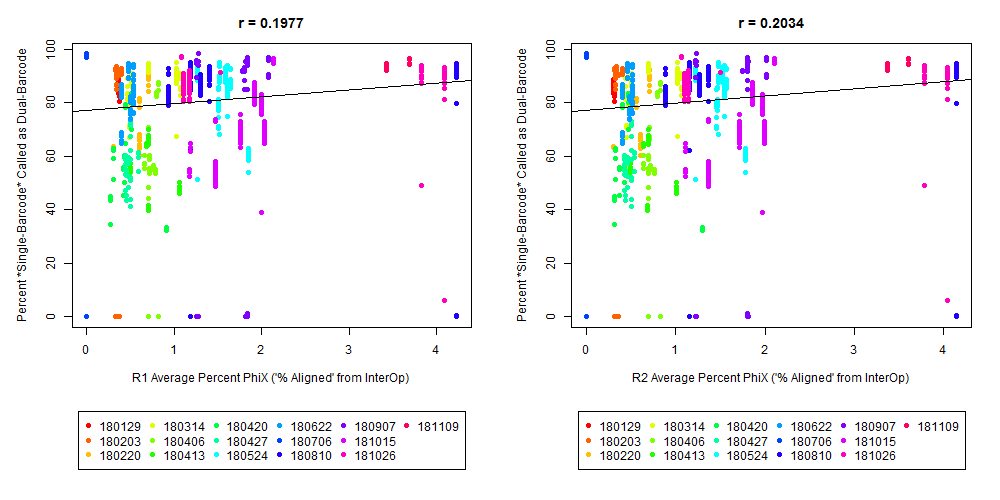
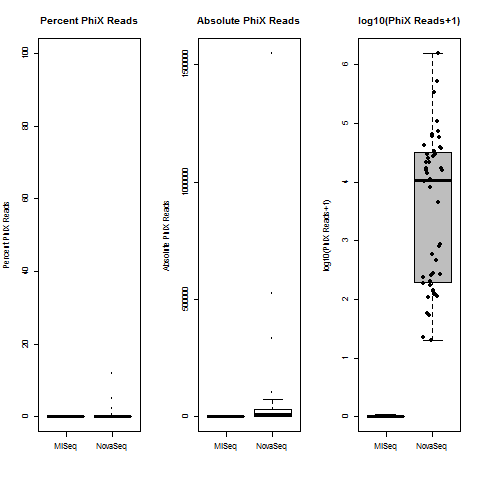
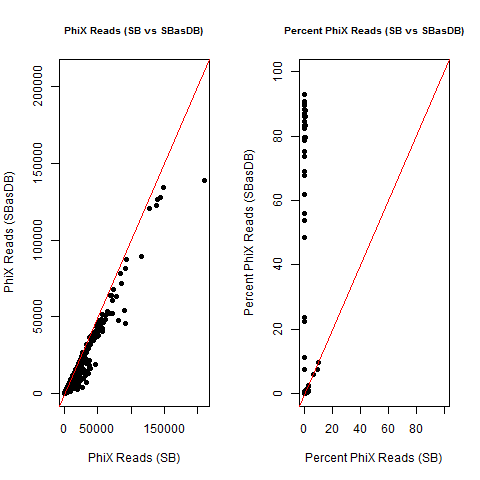
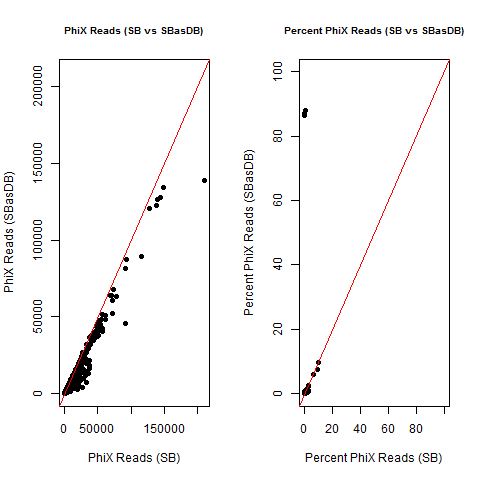
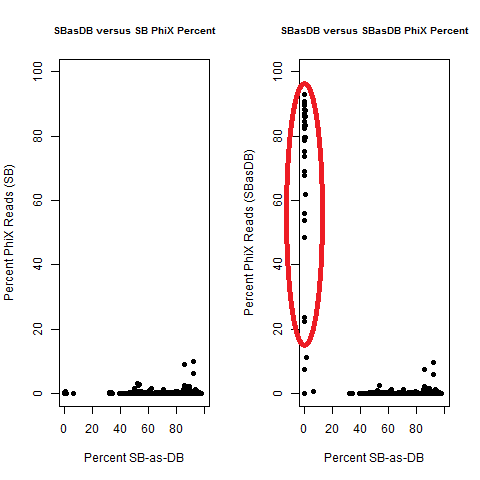
4) What is the average InterOp PhiX spike-in percentage per lane? (please see answer below for more information)

5) If at all possible, do you have experiences from multiple runs? It seems to me like this isn't something that would necessarily happen for every run, but you might notice something after testing several runs. I can't see a particularly problematic combination of samples in what I tested, but it's not beyond possibility that the type of sample (Amplicon-Seq, single-cell RNA-Seq, RRBS, ATAC-Seq etc.) might affect reproducibility for other people. I'm also not sure how often other people even have to have mixed barcode types in a run (which is the subset of runs that I am looking at).

6) Please double-check that you are using bcl2fastq with --barcode-mismatches 0

To be clear, I haven't found a problem in a specific project that I can attribute to the possible quality flags that I mention here. However, if you have some sort of weird low-frequency result, and you test creating index FASTQ files (to test additional filters based upon index quality scores), I think that may also be relevant (although that is not what I have done).

I also don't believe we had any completely dual-barcode runs, but the percent of unassigned reads (such as in slides #26-28) may still be relevant.

Illumina De-Multiplexing barcode quality-scores • 7.7k views
ADD COMMENT
0
Entering edit mode

where we tested calling single-barcode samples as dual-barcode samples:

Can you explain how you did that? Did the samples have 2nd index all along but were run as single index?

Did you try doing two separate
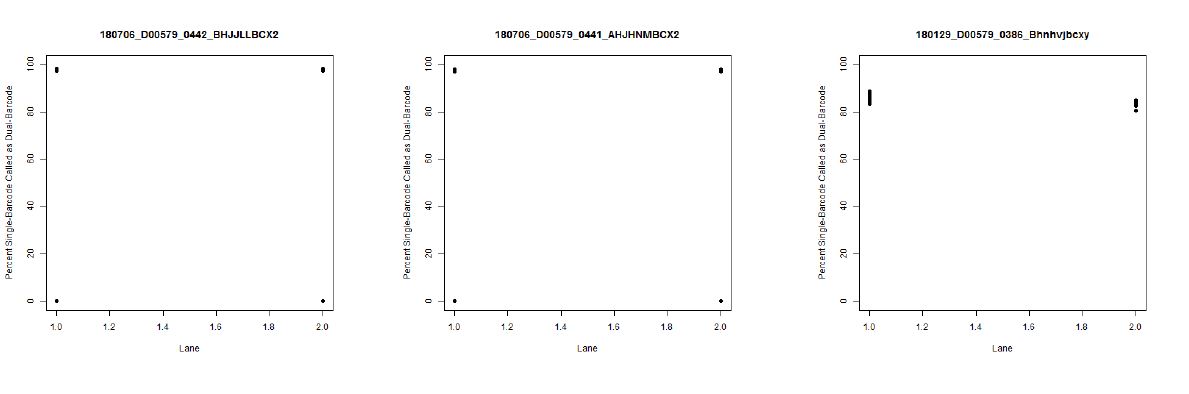
 bcl2fastq runs? Once for 1D samples and another for 2D?

ADD REPLY
0
Entering edit mode

The "experiment" isn't exactly intentional, as least as far as I know, for most of the mixed runs. The only thing I know of that is like an experiment in that is sense is what I believe to be an empty lane on slide #2 (on left side of slide #11 and slide #27). So, overall, I think it might be better thought of as a retrospective study.

We sometimes need to process dual-barcode samples, but we usually don't have runs of all dual-barcode samples. Instead, they are usually mixed within a run (either within a lane or in different lanes per run).

So, in terms of normal procedure, we would return single-barcode samples to users called a single-barcodes, and dual-barcode samples used a dual-barcodes. However, at least until the .bcl files are archived, you can also go back and call the single-barcode samples as dual-barcode samples.

So, for the 1st half of the slides, I am taking about comparing the number of reads for a single-barcode sample, if you treat it like a dual-barcode sample (so, the percent is relative to the actual observed single-barcode reads, until of a starting desired number of reads; the percent expected reads is also important, but the best connection that I could find is what I show on slide #17).

ADD REPLY
0
Entering edit mode

So, there were originally two sample sheets (for single-barcode and dual-barcode).

For most of the results shown, I am adding information for the 2nd index in what was originally a single-barcode sample sheet (for bcl2fastq).

ADD REPLY
0
Entering edit mode

I'm not sure what I can say about some of the specific details, but here is a little more information about extracting the >Q30 Values (Per-Tile, Per-Lane):

When you create the imaging table, you have a Read column. If it is paired-end, there are 4 reads (1 is R1, like you might expect, 4 is the reverse read "R2", 2 is the 1st index, 3 is the 2nd index). If it is single-end, 2 is still the 1st index, 3 is still the 2nd index.

There is also a column for Lane (for these HiSeq 2500 runs, there are 2 lanes for a Rapid Run, and 8 lanes for a Regular Run)

Each row will have a tile, and the information that I am extracting (to create the density of tiles per lane with ) is from the column labeled %>= Q30.

The Per-Tile Per-Lane Density Plots are created with code like this:

input.table = read.table(input.file, head=T, sep="\t")

interop.table = read.csv(interop.file, head=F, skip=2)
partial.col.names = as.character(t(interop.table[1,]))
partial.col.names[is.na(partial.col.names)]="Missing"
interop.table = read.csv(interop.file, head=F, skip=3)

I1.table = interop.table[interop.table[,partial.col.names == "Read"] == 2,]
avg.I1.Q30 = tapply(I1.table[,partial.col.names == "%>= Q30"], I1.table[,partial.col.names == "Lane"], mean)

interop.lanes = unique(interop.table[,partial.col.names == "Lane"])

if(dualBarcode == TRUE){
    I2.table = interop.table[interop.table[,partial.col.names == "Read"] == 3,]
    avg.I2.Q30 = tapply(I2.table[,partial.col.names == "%>= Q30"], I2.table[,partial.col.names == "Lane"], mean)

    png("Q30_distribution_per_lane.png")
    par(mfcol=c(1,2))
    smoothScatter(jitter(I1.table[,partial.col.names == "Lane"]),I1.table[,partial.col.names == "%>= Q30"],
        main = paste("I1 (",flowcell,")",sep=""), xlab="Lane", ylab="%>= Q30",
        xlim = c(0,max(interop.lanes)+1), ylim=c(0,100))
    abline(h=80,col="orange", lwd=2)
    abline(h=60,col="red", lwd=2)

    smoothScatter(jitter(I2.table[,partial.col.names == "Lane"]),I2.table[,partial.col.names == "%>= Q30"],
        main = paste("I2 (",flowcell,")",sep=""), xlab="Lane", ylab="%>= Q30",
        xlim = c(0,max(interop.lanes)+1), ylim=c(0,100))
    abline(h=80,col="orange", lwd=2)
    abline(h=60,col="red", lwd=2)
    dev.off()
}else{
    png("Q30_distribution_per_lane.png")
    smoothScatter(jitter(I1.table[,partial.col.names == "Lane"]),I1.table[,partial.col.names == "%>= Q30"],
        main = paste("I1 (",flowcell,")",sep=""), xlab="Lane", ylab="%>= Q30",
        xlim = c(0,max(interop.lanes)+1), ylim=c(0,100))
    abline(h=80,col="orange", lwd=2)
    abline(h=60,col="red", lwd=2)
    dev.off()
}#end else
ADD REPLY
2
Entering edit mode
4.7 years ago
marcelbrun ▴ 30

Just to add some info, we had a lane of NovaSeq SP XP using UDIs where we got 358M reads when demuxing with i7+i5, with 0 mismatches. In the undetermined file, we found that there were 10M reads where i7 had 1 mismatch and i5 had 0 mismatches, but 24M reads where i7 had 0 mismatches and i5 1 mismatch. Lane 2, with a similar setup, showed similar results.

This represent a 9% data loss compared to using only i7 as barcode (which would work, since we used UDIs), which would provide 382M reads.

This walue is in the same range as mentioned initially (5%-15%), butin this case there is diversity in the i5 barcodes (since we used UDIs). We plan to study deeper the quality scores for these barcodes, since it seems to indicate that in general there is lower quality in the i5 barcodes when using dual indexing.

ADD COMMENT
1
Entering edit mode

Also, even if you aren't a sequencing facility (and may therefore not have access to your index reads), you can get a sense of index mismatches and/or barcode hopping if you have a small fragment size.

For example, if you are feeling ambitious, you could take a look at some of the code that I wrote here, and here is a screenshot of the adapter structure on the reverse complement that I was checking:

sequenced adapters

ADD REPLY
1
Entering edit mode

"A loss of 5-15% of reads is a better problem than 5-15% of cross-contamination of reads" ... I agree 100%. I see your point about the difference in i5 quality between SE and PE. It seems like it is very common based on online posts. In our case, when we combine projects with different barcodes (single index + dual index), If we use one sample sheet per project (using the original barcode specification for each samplesheet) then we get a huge undetermined file for each demuxed project, which contains not only the undemuxable reads, but all the other projects reads (which in a Novaseq run, may represent almost 1Tb per undetermined file). The demuxing time also increases considerably. To solve that, we treat single indexes as dual indexes and use only one samplesheet to demux all the projects together. This way, the "undetermined" file makes sense (it contains only these reads not included in any project). Is that the reason you are also extending single index to dual index?

ADD REPLY
0
Entering edit mode

To be honest, I don't remember exactly why it was done the first time (I think our manager Jinhui Wang asked me to do something for one run, and then the IGC director Xiwei Wu asked me to check other runs).

However, I think I pretty much agree with your concerns. In particular, if we don't get enough reads, combining reads between runs adds extra complications (and time).

While I provide an index Q30 plot with code similar to what I provided (at least when I assist with base calling), we don't currently call all single-barcode samples as dual-barcode samples. I think one reason is that you always have to do separate single-barcode base calling for 10X samples, and I think the other reason is that low quality scores for I2 may have a greater impact on the true dual-index samples than the single-index samples. However, I think questioning whether this should be done on a regular basis for all regular Illumina libraries (meaning we have to find strategies to keep I2(i5) quality scores high) is a point of discussion worth having with the community.

ADD REPLY
0
Entering edit mode

Thank you for the feedback.

I also hadn't though about changing where you allow 1 mismatch (when starting with dual-barcode samples). That was a good idea.

A loss of 5-15% of reads is a better problem than 5-15% of cross-contamination of reads (however, with the exception of the PhiX example or protocols with unique sequences and/or different species, that may be hard to detect - unless you spike-in a unique sequence that is different for each sample).

However, this is certainly relevant to my original question, where certain runs could lose 50% of reads if you ran single-barcode samples as dual-barcode samples (but I realize that you probably have to use the missing reads, if you are starting from dual-barcode samples).

However, as a reminder for other readers, here is the range of I1 and I2 quality scores, and the SingleBarcode-as-DualBarcode percentages. So, for a "good" run, I think that matches you <15% loss when using the 2nd barcode (the y-axis in the 2nd image).

enter image description here

I2 quality scores on SB-as-DB

I think the quality score system is different for NovaSeq,

In term of batch effects per lane, here is the percent kept (SingleBarcode-as-DualBarcode) for paired-end samples:

Regular Run PE SB-as-DB

And here is the percent kept (SingleBarcode-as-DualBarcode) with with single-end samples:

Regular Run SE SB-as-DB

The number of runs is limited, using a Rapid Run (versus a HiSeq Regular Run) also seems to help:

Rapid Run PE SB-as-DB

Thank you again - I am really excited to hear about other people's experiences!

Also, to be clear, these are usually 51 bp single-end sequences (and 2 x 101 bp paired-end sequences). Since this was not a planned experiment, the read lengths are not kept constant (we would expect the trend to be less of an issue with shorter paired-end reads).

ADD REPLY
1
Entering edit mode
5.0 years ago

I'm not clear why anyone would process single index cells as dual index. You are just making it more likely for reads that have perfect index1 sequences to fail, especially if the lane has a uniform index2 sequence, which causes problems with base calling.

(edited for clarity)

ADD COMMENT
0
Entering edit mode

I apologize for the confusion.

I think one important question is How important are the I2 (2nd Index) quality scores?

The single-barcode FASTQ files are what are being returned for the single-barcode samples. However, this allows us to use that observed read count to see how many reads are still kept if you use the information about the 2nd barcode (for the mixed dual-barcode samples).

However, I don't know how often people with mix those sample types: it is completely possible one piece of advice is to try and avoid having mixed barcode runs (and then the question is How do you do that? Do you do user lower-throughput machines for the barcode type with the smaller number of samples / expected reads? Do you wait longer to process those samples?). The other issue of having less than the expected matter of reads can also matter when you only need extra reads for a few of the dual-barcode samples in a run that is mostly single-barcode samples.

ADD REPLY
2
Entering edit mode

It is not surprising that the Q scores for the second index are bad because they would be considered to have low-nucleotide diversity for the samples that are 1D indexed (same 2nd index being seen for every cluster).

When you returned data to customers you did do so using two separate bcl2fastq runs, correct?

ADD REPLY
0
Entering edit mode

Correct - in terms of reads for user's experiments, the bcl2fastq command was run separately for the two types of samples (only using the 1st index for the single-barcode sample), with separate sample sheets.

However, while they are less than the provided reads (at least to some extent, as expected), the additional experiment that I describe in the beginning of the summary tests the extent of read loss when the single-barcode samples are treated like dual-barcode samples.

While I don't show those results, interop also provides a Signal To Noise value (and I also looked at some other diversity metrics that I calculated). However, it seemed like the I2 >Q30 values were more relevant for read loss when treating a single-barcode sample as a dual-barcode sample.

I'm not sure if you are interested, but I do have some extra plots with Density Pf(k/mm2) (minimum per-tile per-lane, slide #29) and Cluster Count Pf (k) (summed across tiles per lane, then divided by the sum of Cluster Count (k), slide #30) from the interop table.

ADD REPLY
0
Entering edit mode

Also, in terms of the quality scores, perhaps emphasizing the paired-end (PE) versus single-end (SE) difference (for single-barcode samples treated as dual-barcode samples) is important?

Quality Score Noticeably Varies for PE versus SE

The image above is from slide #14.

If it was just diversity, I don't think that should matter as much for read loss. However, you tend to lose fewer reads with SE dual-barcode samples than paired-end dual-barcode samples.

While kind of messy, the possible connection to the expected reads is shown here (where certain sectors seem more likely if you have PE dual-barcode versus SE dual-barcode, where I think lower I2 quality scores are a relevant factor):

SB-as-DB loss more tends to be more noticeable for SE dual-barcode samples than PE dual-barcode samples

The image above is from slide #17. To be fair, I should emphasize the difference in the total number of runs (and not showing the density of points, but the plots for SE dual-barcode samples on slides #12 and #13 are noticeably different, than for PE dual-barcode samples on slide #5 and slide #8).

ADD REPLY
1
Entering edit mode

Is the quality score plotted an average per read?

Pardon me for saying this but I am not still not getting the significance of this. Treating SE reads as PE is "off-label" application in a sense. Note: I ran a similar analysis (PE/SE mixed) today. I will look at your method tomorrow to see what difference it makes in read numbers, if one treats SE samples as PE.

ADD REPLY
0
Entering edit mode

Thank you very much for your response.

In most cases, I don't think you'd want to call single-barcode (SB) samples as dual-barcode (DB) samples, but I think this is more about the quality flags (and/or explaining read loss, if you observe it).

However, perhaps I should also copy over a screenshot of slide #2, to explain the read/barcode design:

Illumina Barcode Design

  • Single-End (SE) means you just have a forward read (R1)
  • Paired-End (PE) means you have both a forward (R1) and reverse read (R2)
  • If you have a lower-throughput sequencer (say, an iSeq), I'm guessing you will be doing Single-Barcode (SB) libraries with an I1 (also called i7) index (for either SE or PE). Or, you might not even do any de-multiplexing in some cases. However, I believe Illumina has a limit of 64 6 bp "official" I1 barcodes for those indices (to assign reads to people's individual samples within a lane).
  • So, one way to combine more samples per lane is to use Dual-Barcodes (DB), using both an I1 index and an I2 index. I believe most of these are 8+8 index designs (so, both the first and second index are 8 bp long)

That said, you don't automatically output the index reads (I think 10X is the only situation where I have seen that). If you don't sequence samples in your own lab (and/or keep the .bcl files for the previous runs readily accessible), then you can't check the I1 or I2 quality score (you just know that they were from Pass Filtered (PF) clusters, with some set of parameters for bcl2fastq). You would have to ask for assistance from whomever has the even more raw data than your FASTQs (which might be an issue if your run is from more than a year ago). However, again, I don't know if this is something people should be concerned about.

However, if this is a relevant quality flag, then the evidence that I have so far indicates that this is probably more likely to be a something to check for Paired-End Dual-Barcode samples than Single-End Dual-Barcode samples because the index is defined at a later cycle (so, if you had some weird low-frequency results, perhaps it might be worth considering running bcl2fastq with --barcode-mismatches 0 and/or checking if they remain after further filtering your reads by index quality score)

Also, I should probably mention that I believe all PE samples are 101 bp +101 bp and all SE samples are 51 bp. So, if you had a PE experiment but used shorter reads (such as 50 bp + 50 bp), that would have less of an effect on I2 quality scores.

I also have other thoughts on slide #20. I apologize for not being clear, but I hope that helps in terms of the possible significance.

ADD REPLY
0
Entering edit mode

As for your question about quality scores, I am taking a shortcut:

If you output FASTQ files for I1 and I2, you would have quality score per-read (separated in one file per sample).

However, you already have "% >Q30" values produced in your folder with the .bcl files. There are binary files, so I needed to use interop to convert them to text files (which are still pretty small).

Once you do that conversion, the data provides information per tile (with columns to indicate "read" as 1-4, for R1-I1-I2-R2, and lane 1-2 for "Rapid" HiSeq run or 1-8 for "Regular" HiSeq run). So, you'll want to filter the table for subsets of rows, if you want to create those plots where you show the distribution of tile % >Q30 values per lane. Otherwise, for the scatter plots, I am taking the average of those values (and the change in overall distribution may not be as clear then).

I am also cheating a little bit: each lane can have an average % >Q30, but that table is too small to assign them to samples. So, if multiple samples are in the same lane, they will have the same values for whatever axis plots the average quality score.

Nevertheless, if the goal is to determine if there is a need to re-process an entire lane or run (and I am checking what other people think about the quality flags that I am proposing), I think that density plot per lane is reasonable.

Still, this means ">40% of samples have <50% Q30 I2 Reads" can really only be defined at a run level (each lane has one average value), so thank you for asking about that.

ADD REPLY
0
Entering edit mode

I also modified the title, which hopefully frames the question about the 3 possible run QC flags a little better.

Thank you again!

ADD REPLY
1
Entering edit mode

I looked at the read numbers of 1D samples called as 2D. They resulted in a max loss of about ~2% reads when TCTTTCCC was considered as 2nd index. You appear to see much great read loss in comparison. This was a MiSeq nano run. This pool will eventually run on NovaSeq but it may be some time.

ADD REPLY
0
Entering edit mode

Thank you very much for your reply!

I don't want to take up too much of your time. With the HiSeq2500, even when only focusing on these mixed runs, some would be OK (even though 2% loss is noticeably less than 5% or 15% loss, and certainly less than the ~50% loss) but I think you may need to have 4-5 runs before you encounter one that may require closer inspection (in terms of the QC flags).

Again, I don't know the cause, but these are my thoughts:

1) If TCTTTCC was in fact the 2nd barcode, I think the read loss was a little better for mixed HiSeq Rapid Runs (not exactly the same as the MiSeq, but uses 2 lanes instead of 8, and there is some decrease in throughput). While that may be a little hard to see, that is what I am showing for 2 out of 3 runs on slide #6 (although I'm also trying to show limited evidence that you have less weird lane effects for PE SB-as-DB Rapid Runs on slide #6 and SE SB-as-DB runs on slide #12, compared to PE SB-as-DB Regular Runs on slide #5)

2) At least for that 1 run, that seems like it could be consistent with the possibility that having less read loss issues with lower throughput machines, but I think more runs from more labs would be better. Nevertheless, thank you very much for your contribution! Anything people can provide should be helpful!

3) Just to double-check, are you running bcl2fastq with --barcode-mismatches 0? If you allow mismatches, that will also decrease read loss.

4) I'm not sure if it matters, but these are in range of approximately 400-500 runs. If you don't mind me asking, is this the similar age for your MiSeq sequencer?

Update (4/27): I think my answer was OK for what we were discussing. However, if other people see this in terms of the original possible QC flags, I think you may need to see closer to 10 runs to encounter something like the >20% read loss and/or the <200 million PF clusters (all other things being equal, even though that's the part I don't know).

ADD REPLY
1
Entering edit mode
  1. Don't know if we should consider TCTTTCCC a real index. It is what gets sequenced as index 2 for samples that are really single indexed.
  2. I may be able to update the numbers when NovaSeq happens.
  3. In this case the demux runs were using perfect matches.
  4. This particular MiSeq was bought when they were originally announced so it may be even older.
ADD REPLY
0
Entering edit mode

Great - thank you very much!

The point about usually not having a "real" second barcode may be important. Thank you for emphasizing that.

I also edited my previous response, just to be a little more safe / conservative about drawing conclusions.

Thanks again!

ADD REPLY
0
Entering edit mode

Update (8/12/2019): There was something that I misunderstood about the 2 HiSeq 2500 sequencers, which I am updating here. While there are physically 2 HiSeq 2500 sequencers in the building, all the runs in this post are from the newer sequencer.

The first sequencer was originally a HiSeq 2000 (from 2011), which was upgraded in 2013, but the last run for that machine was in 2017 (with 400+ runs). The 2nd HiSeq2500 was from 2014, where I am presenting runs from approximately 380 to 480 runs.

So, perhaps "number of runs" could be more important than "age." However, right now, I have a limited amount of other data from other sequencers. So, I'm not sure how much that matters.

ADD REPLY
0
Entering edit mode

I am afraid I lost the train of thought in this thread a while back but what are you referring to here? We have sequencers of both type which have gone through 600+ runs.

ADD REPLY
0
Entering edit mode

No problem.

That newer HiSeq 2500 is currently at 600+ runs.

While I'm not sure exactly what to say, at least this means there is at least one other facility that it sounds like has similar use of their machine.

Thank you very much for the prompt feedback!

ADD REPLY
0
Entering edit mode

P.S. - Thank you very much for your comments/responses!

This is already more than individuals per thread than I have encountered for any Disqus-based comment system (even though I also think that Disqus is a really great addition to peer-reviewed journals and pre-prints: so, I think Biostars and Disqus should complement each other):

https://disqus.com/by/charleswarden/

ADD REPLY
0
Entering edit mode
5.0 years ago

Since the comments above were branching out (which I think is great!), I thought perhaps I should add this extra figure as an extra "answer" to why I think the I2 quality scores are important (in terms SE dual-barcode samples having higher quality scores, and losing fewer reads)

enter image description here

ADD COMMENT
0
Entering edit mode

If the font is hard to read, the x-axis is quality score (Percent >Q30), the y-axis is read retention (for SingleBarcode-as-DualBarcode samples, from mixed runs).

Also, if you are trying to compare with your own runs, please note that I am running bcl2fastq with --barcode-mismatches 0. By default, I believe Illumina is allowing mismatches, but please double-check with your configuration.

ADD REPLY
0
Entering edit mode
5.0 years ago

To be clear and fair, I thought I should repeat a couple things here:

1) Please remember that these are a subset of mixed runs (with at least one dual-barcode and at least one single-barcode sample). While troubleshooting missing reads with when running bcl2fastq with --barcode-mismatches 0 may still be relevant (such as in slides #26-28), but this may be less of an issue if you don't mix barcode types (which is the point that swbarnes2 brings up).

2) When calling single-barcode samples as dual-barcode samples, I am typically using the adapter sequence in place of the 2nd barcode (unless the library was dual-barcode and only the 1st barcode was used to assign reads to samples). This may also cause the results to be have differently than a normal dual-barcode dataset (as mentioned by genomax).

Nevertheless, if any of the 3 possible QC flags (I2 Q30, insufficient reads, and/or lower PF clusters) applies to your run, I think that may help this discussion.

ADD COMMENT
0
Entering edit mode
4.9 years ago

FYI, I performed additional analysis because this paper recommended using high percentages of PhiX spike-ins for MiSeq Amplicon-Seq data:

InterOp Average Percent PhiX Per-Lane

I’m not entirely sure what to think about that recommendation, but the range of 0-5% shown above is certainly less than the reported recommendations of 5-50% cited in that paper (although that was for low-complexity libraries, and should be higher than for a normal library). However, I believe the percentages reported in this discussion group are more similar to what we observed, and we were expecting <5% PhiX spike-in.

To be clear, these use the forward read (R1) or the reverse read (R2), not the indices (I1 or I2) focused on for the other quality score discussion (which don’t contain PhiX content). Also, these plots are by-lane, not by-sample (sometimes, one sample is in multiple lanes/runs).

I also noticed that, if I use a Bowtie2 alignment to NC_001422 (selected based upon this discussion) on de-multiplexed samples from the lane of the mixed run with ~5% PhiX, I get lower estimates (between 1.08-1.47% reads). However, by that metric, the PhiX percentage among the “Undetermined” reads for that run was 60.6% (for ~6% of total reads, which I believe largely explains the discrepancy). While there is a trend for an increase in Percent PhiX runs (shown above), and some improvement in the SingleBarcode-as-DualBarcode percentage in later runs (slide #7, top-right), there only seems like a possible benefit among runs with average InterOp PhiX > 3%:

Correlation between average InterOp PhiX and SingleBarcode-as-DualBarcode percentage

In other words, among the runs with an average PhiX < 2%, the precise (mean) “% Aligned” value from the InterOp files doesn’t predict which runs have substantially lower SingleBarcode-as-DualBarcode for the reads kept. Also, the lane with slightly more than 5% InterOp PhiX with R1 and slightly less than 5% PhiX with R2 is missing from the SingleBarcode-as-DualBarcode plot because that is for 6 bp SB samples in lanes 1-5 in that run (and that particular outlier lane, lane 6, had 8 bp SB samples).

In summary:

1) There were relatively more lanes with SingleBarcode-as-DualBarcode percentages > 95% later in 2018. This is still not the perfect explanation, but there also seems to be some increase in the average InterOp “% Aligned” (which is the InterOp PhiX spike-in percentage). However, I also show the PhiX percentage is not predictive of SingleBarcode-of-DualBarcode percentage when average InterOp PhiX percentages are between 0-2%. However, I would be interested to know if other people have observed benefits to having PhiX spike-ins >3% for a regular run (instead of 0-2%), which could specifically be for the SingleBarcode-as-DualBarcode percentage (or other metrics).

2) You can check for PhiX alignments with your samples (such as a Bowtie2 alignment to a RefSeq PhiX sequence). However, that number was noticeably different (lower) than the InterOp PhiX percentage, when I checked the lane with the highest InterOp percentage (1.08-1.47% for sample FASTQ, versus average of 5.10% for InterOp R1 and average of 4.95% for InterOp R2). The “Undetermined” reads is likely a major part of the explanation, but that means you need to have access to the InterOp files (via command line or the Sequence Analysis Viewer interface) and/or the “Undetermined” reads to estimate / confirm the PhiX spike-in percentage.

I would like to thank Xiwei Wu and Jinhui Wang for some general discussions about PhiX (before I posted this), and I believe taking more time to think about this topic before posting was extremely helpful. However, these reflect my individual opinions because they did not review this draft in detail.

ADD COMMENT
0
Entering edit mode

The PhiX spike-in percentage is admittedly something that I was previously confused about (I’ve checked FASTQ files for PhiX reads, but I didn’t previously realize you needed to go back to the run data to get accurate information about the PhiX spike-in percentage).

While I don’t want to show individual user data in the forum, I am willing to share PhiX alignments for some of my own data:

FASTQ Bowtie2 PhiX percentages in selected American Gut and uBiome data

It looks like there is more PhiX reads in the American Gut samples (which, qualitatively, looks like PhiX coverage for the IGC samples from the lane with the ~5% PhiX spike-in), but that one uBiome read is a discordant read (where one end maps to PhiX, and I assume the other maps to a 16S sequence). So, I think the difference is really that I was provided filtered reads from uBiome (and other vendors, not shown). However, that is really just my guess; for example, for other samples with 0 PhiX reads (not shown), I don’t know what the starting PhiX percentage was closer to 0% or closer to 5% (or higher). However, PhiX spike-ins are supposed to be higher for low-complexity sequences (like the 16S samples shown above).

ADD REPLY
0
Entering edit mode

While I have been informed that the samples have been withdrawn (which I can at least confirm for [LC403400][1]), I did note that some PhiX samples were inaccurately described as 16S samples (as the top BLAST result for PhiX sequences).

[please see note below: it looks like this problem has been fixed]

ADD REPLY
0
Entering edit mode

Update (10/18/2019): At one point, an individual sequence was fixed, but most random PhiX sequence would have a top 16S hit (which I think were from Oshiki et al. 2018 study, from Bioproject PRJDB7080)

However, I tried a few random PhiX sequences, and they now have top PhiX hits.

I'll tell myself that was a success for Biostars and post-publication review :)

ADD REPLY
0
Entering edit mode

Update (4/28/2010): When I was BLASTing an assembly, I noticed that the issue of non-PhiX top BLAST hits for PhiX sequence has come up again.

As of today, I could see that for this sequence:

>PhiX_test
CGATTTTCTGACGAGTAACAAAGTTTGGATTGCTACTGACCGCTCTCGTGCTCGTCGCTGCGTTGAGGCT

Unfortunately, I don't think my previous message was made sufficiently clear, since I assume this means other labs are not realizing that they have PhiX sequence in their reads. I hope there is a way that I can make the warning more clear to the broader community.

In terms of a peer-reviewed study, this is discussed in Mukherjee et al. 2015, and knowledge of FASTQ PhiX contamination is described in this tutorial from the UC-Davis Bioinformatics Core.

ADD REPLY
0
Entering edit mode

FYI, there is no barcode for the PhiX spike-ins, so there shouldn’t actually be any PhiX reads in the de-multiplexed samples.

In terms of the eDNA study, I have aligned the publicly available reads to the PhiX genome (used by Illumina for RTA). While I don’t know the details of their barcode design, there were no PhiX reads in the MiSeq samples but there were always some PhiX reads in the NovaSeq samples:

eDNA study has PhiX reads in de-multiplexed NovaSeq but not MiSeq samples

In the interests of the fairness, I have plotted the percent PhiX on the left as well as the log10(absolute PhiX read counts) on the right. The counts are from samtools idxstats, so I have divided them by 2 (as an approximation from the paired-end alignments, having run Bowtie2 with the --no-unal parameter).

ADD REPLY
0
Entering edit mode

Due to this observation from the eDNA paper described above, I started out looking at the lane with the highest InterOp PhiX percentage (~5%). I noticed that the sample with >1 million PhiX reads could be reduced to having about 2 dozen PhiXs if the 2nd barcode was used.

I think Illumina has some additional guidelines, but I think the short answer is that they don’t recommend running samples with mixed barcode designs and they have previously seen evidence that use of the 2nd barcode can have benefits for demultiplexing.

However, I think one factor that may be worth considering is that particular lane had a different I2 for the de-multiplexed samples (TATAGCCT) than the PhiX spike-ins (TCTTTCCC), with an 8 bp single-barcode. In order words, using the dual-index helped because PhiX spike-ins had a different 2nd index than the samples. In contrast, most of the SIngleBarcode-as-DualBarcode samples use TCTTTCCC as the I2 sequence.

When I check for broader association with the 6 bp I2 sequences (with the same strategy as the re-analysis of the eDNA paper, described above), there was actually an increase in the PhiX percent for SingleBarcode-as-DualBarcode samples (among samples starting with >100,000 SingleBarcode reads):

if only filtering by starting SB reads, some samples have increased PhiX

However, most of those outlier points come from samples with low absolute SingleBarcode-as-DualBarcode counts. For example, these are the plots if you only include samples with >100,000 SingleBarcode-as-DualBarcode reads:

most higher SBasDB PhiX percentages removed with SBasDB read count filter

Perhaps this is more clear when you look at the SingleBarcode-as-DualBarcode percentage:

in terms of SBasDB, outliers all had wrong 2nd barcode; to be clear, correct I2 could be determined, but this shows what happens if it is not correct

In other words, please remember that this plot is created by assuming that the TCTTTCCC is the 2nd barcode. I can actually figure out the right 2nd barcode using the “Undetermined” read barcodes, but the point is that all SB-as-DB samples with >20% PhiX in the de-multiplexed FASTQ files have the wrong 2nd barcode, at least prior to determining the correct I2 barcode (and, again, those samples should theoretically have no reads, and it would make sense that PhiX would then be a large percent of reads incorrectly assigned to a sample).

ADD REPLY

Login before adding your answer.

Traffic: 2768 users visited in the last hour
Help About
FAQ
Access RSS
API
Stats

Use of this site constitutes acceptance of our User Agreement and Privacy Policy.

Powered by the version 2.3.6