GLM to predict what SNP influences DNA-methylation
1
1
Entering edit mode
5.6 years ago
svenbioinf ▴ 10

Dear biostars-community,

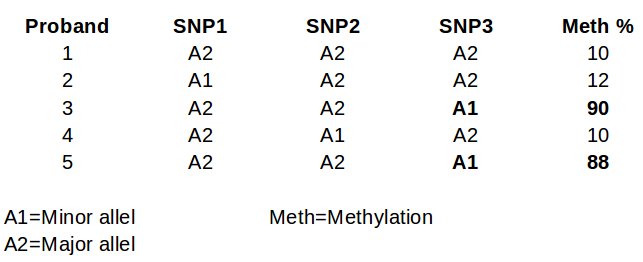
Given below table I would like to determine which SNP(s), that are near a specific region have the most influence on this region's DNA methylation. My idea was to define a glm like this:

  • model.full = glm(meth% ~ SNP1 + SNP2 + SNP3... )

with: Independent categorial variables: SNP1, SNP2 ... Dependent continuous variable: meth%. In the simplified example below SNP3 would be most influential on methylation.

Questions:

  1. Is this the (a) suitable approach
  2. Is there a maximum number of independent variables (Some regions have 100+ SNPs = 100+ independent variables)

I would really appreciate any help and thoughts on that! Thank you.

example2

R glm SNP Methylation DNA • 2.2k views
ADD COMMENT
0
Entering edit mode

Is there any particular reason or hypothesis suggesting that SNPs' effects on DNA methylation are local? I would guess methylation status in a region could well be influenced by variants very far away?

ADD REPLY
0
Entering edit mode

That is true, Vitis.

ADD REPLY
3
Entering edit mode
5.6 years ago

Hi Sven,

Seems like a very interesting project. I would do the following:

  1. prune your SNP dataset based on linkage disequilibrium (LD) so that you are only looking at the most informative SNPs and also to reduce your variable load (OPTIONAL)
  2. for each methylation region, take SNPs within a defined window surrounding the region and test each independently
  3. for each methylation region, take the statistically significant SNPs and put those in the final model
  4. reduce the final model further through stepwise regression (OPTIONAL)
  5. test the final reduced model's robustness via r-squared shrinkage, ROC analysis, and cross-validation

----------------------------------------------

In part 2, when I say 'test each independently', I mean:

glm(meth% ~ SNP1)
glm(meth% ~ SNP2)
glm(meth% ~ SNP3)
et cetera

In part 3, if SNP2, SNP3, SNP8, and SNP9 were your statistically significant SNPs, then the final model would be:

final <- glm(meth% ~ SNP2 + SNP3 + SNP8 + SNP9)

Regarding your SNP encoding, you can have these as:

  • continuous variables (counts of minor alleles)
  • categorical variables (HomMinor, HomMajor, Het)

Regarding your outcome, you can equally encode this as continuous or categorical.

Instead of glm, you could also do lasso-penalised regression. You can also build multiple models in various ways and then compare them, as I do here:

roc

I go over more on these things here:

There's a lot of other material on Biostars and elsewhere, too.

Kevin

ADD COMMENT
1
Entering edit mode

Thank you for sharing that information.

In that plot, it looks like the linear model (which I believe you expect to comparable to the glm() generalized linear model in this discussion) is similar (if not slightly better) than the more complicated model.

In general, I think this is interesting because I believe using more complicated models can often decrease validation / reproducibility in other experiments (although it is certainly necessary in some cases), but I don't think there is a severe issue with over-fitting in this situation (with the possible exception of the ridge regression).

I also highly recommend testing multiple analysis strategies for your project - good suggestion!

ADD REPLY
1
Entering edit mode

Hey Charles, good to see you again. Yes, simplicity is best it seems, for building these models at least. I don't ever recall a situation where a Random Forest, 'deep neural network', or other machine learning classifier actually beat a simple lm or glm fit. I have been skeptical about the lasso regression for a while, too.

ADD REPLY
0
Entering edit mode

To give an update on this question (might be interesting for others as well): I was super happy with the suggestions you made and also used that glm to generate some results using the following input: GLM Input

The last two columns represent predictor and response variable respectively. With a glm in R defined as glm(data,meth~SNP's,family = gaussian)

And using Kruskal Wallis test in a boxplot one can really see the change in Methylation altered by different alleles:

Boxplot of one SNP's influence on Methylation

However then some colleague pointed out that the response variable (Methylation) might not be normally distributed. And in fact it is not:

Distribution of Methylation data

Which I confimed by qqplot (not shown). It doesnt look like any of the usual distributions (Poisson, gamma etc)

  1. What family should I choose?
  2. To add to the confusion some sources say it is about the distribution of the error and not about the response variable at all. errorLink

Does anyone have experience in that matter? Thanks a lot!

ADD REPLY
0
Entering edit mode

Hey, yes, you should check the residuals from the model. The default for glm() is gaussian, as you know.

ADD REPLY
0
Entering edit mode

Using Shapiro Wilk normality test for the residuals tells me the residuals are normally distributed:

> shapiro.test(residuals(fit))

data: residuals(fit) W = 0.9621, p-value = 0.3699

So that basically tells me that the model is still valid. Thank you very much for your input!

ADD REPLY
0
Entering edit mode

Okay - cool. You may want to read a bit on the Shapiro Wilk test, though. I have heard that it is unreliable in certain situations. There is a lengthy debate on CrossValidated (StackExchange) somewhere

ADD REPLY

Login before adding your answer.

Traffic: 1534 users visited in the last hour
Help About
FAQ
Access RSS
API
Stats

Use of this site constitutes acceptance of our User Agreement and Privacy Policy.

Powered by the version 2.3.6