
Note1 - Previous version: Produce PCA bi-plot for 1000 Genomes Phase III in VCF format (old)
Note2 - this data is for hg19 / GRCh37
Note3 - GRCh38 data is available HERE
The tutorial has been updated based on the 1000 Genomes Phase III imputed genotypes. The original tutorial was performed on non-imputed data held at the University of Washington, which is no longer accessible.
Other changes:
- tutorial now entirely streamlined - all commands, including in R, are now included
- duplicate variants are now removed with BCFtools, not PLINK (previous Step 6 removed)
- now only performs PCA (originally, MDS was also performed but never used)
- no longer using chrX variants (only autosomal variants)
- new Step 3, indicating how to download the 1000 Genomes GRCh37 reference build
Program requirements:
- plink > v1.9
- BCFtools (tested on v 1.3)
Disk space requirements:
- downloaded data (VCF.gz and tab-indices), ~ 15.5 GB
- converted BCF files and their indices, ~14 GB
- binary PLINK files, ~53 GB
- pruned PLINK binary files, ~ <1 Gb
1, Download the files as VCF.gz (and tab-indices)
prefix="ftp://ftp.1000genomes.ebi.ac.uk/vol1/ftp/release/20130502/ALL.chr" ;

suffix=".phase3_shapeit2_mvncall_integrated_v5b.20130502.genotypes.vcf.gz" ;

for chr in {1..22}; do
    wget "${prefix}""${chr}""${suffix}" "${prefix}""${chr}""${suffix}".tbi ;
done
2, Download 1000 Genomes PED file
wget ftp://ftp.1000genomes.ebi.ac.uk/vol1/ftp/technical/working/20130606_sample_info/20130606_g1k.ped ;
3, Download the GRCh37 / hg19 reference genome
wget ftp://ftp.1000genomes.ebi.ac.uk/vol1/ftp/technical/reference/human_g1k_v37.fasta.gz ;
wget ftp://ftp.1000genomes.ebi.ac.uk/vol1/ftp/technical/reference/human_g1k_v37.fasta.fai ;
gunzip human_g1k_v37.fasta.gz ;
NB - if wget is not working, try curl:
curl ftp://ftp.1000genomes.ebi.ac.uk/vol1/ftp/technical/reference/human_g1k_v37.fasta.gz -O human_g1k_v37.fasta.gz
4, Convert the 1000 Genomes files to BCF
- Ensure that multi-allelic calls are split and that indels are left-aligned compared to reference genome (1st pipe)
- Sets the ID field to a unique value: CHROM:POS:REF:ALT (2nd pipe)
Removes duplicates (3rd pipe)
-I +'%CHROM:%POS:%REF:%ALT'means that unset IDs will be set to CHROM:POS:REF:ALT*-x ID -I +'%CHROM:%POS:%REF:%ALT'first erases the current ID and then sets it to CHROM:POS:REF:ALT*
for chr in {1..22}; do
    bcftools norm -m-any --check-ref w -f human_g1k_v37.fasta \
      ALL.chr"${chr}".phase3_shapeit2_mvncall_integrated_v5b.20130502.genotypes.vcf.gz | \
      bcftools annotate -x ID -I +'%CHROM:%POS:%REF:%ALT' | \
        bcftools norm -Ob --rm-dup both \
          > ALL.chr"${chr}".phase3_shapeit2_mvncall_integrated_v5b.20130502.genotypes.bcf ;

    bcftools index ALL.chr"${chr}".phase3_shapeit2_mvncall_integrated_v5b.20130502.genotypes.bcf ;
done
5, Convert the BCF files to PLINK format
for chr in {1..22}; do
    plink --noweb \
      --bcf ALL.chr"${chr}".phase3_shapeit2_mvncall_integrated_v5b.20130502.genotypes.bcf \
      --keep-allele-order \
      --vcf-idspace-to _ \
      --const-fid \
      --allow-extra-chr 0 \
      --split-x b37 no-fail \
      --make-bed \
      --out ALL.chr"${chr}".phase3_shapeit2_mvncall_integrated_v5b.20130502.genotypes ;
done
6, Exclude variants not on the coding strand
NB - This step is only for microarray studies where the probes may only target one strand or the other (sense or non-sense)
7, Prune variants from each chromosome
--maf 0.10, only retain SNPs with MAF greater than 10%--indep [window size] [step size/variant count)][Variance inflation factor (VIF) threshold]
e.g. indep 50 5 1.5, Generates a list of markers in approx. linkage equilibrium - takes 50 SNPs at a time and then shifts by 5 for the window. VIF (1/(1-r^2)) is the cut-off for linkage disequilibrium
mkdir Pruned ;

for chr in {1..22}; do
    plink --noweb \
      --bfile ALL.chr"${chr}".phase3_shapeit2_mvncall_integrated_v5b.20130502.genotypes \
      --maf 0.10 --indep 50 5 1.5 \
      --out Pruned/ALL.chr"${chr}".phase3_shapeit2_mvncall_integrated_v5b.20130502.genotypes ;

    plink --noweb \
      --bfile ALL.chr"${chr}".phase3_shapeit2_mvncall_integrated_v5b.20130502.genotypes \
      --extract Pruned/ALL.chr"${chr}".phase3_shapeit2_mvncall_integrated_v5b.20130502.genotypes.prune.in \
      --make-bed \
      --out Pruned/ALL.chr"${chr}".phase3_shapeit2_mvncall_integrated_v5b.20130502.genotypes ;
done
8, Get a list of all PLINK files
find . -name "*.bim" | grep -e "Pruned" > ForMerge.list ;
sed -i 's/.bim//g' ForMerge.list ;
9, Merge all projects into a single PLINK file
plink --merge-list ForMerge.list --out Merge ;
NB - if you have your own data that you want to merge with 1000 Genomes
Process the 1000 Genomes data as per this tutorial from Steps 1-9. In this way, you will have already identified the population-specific variants / markers. Then, after Step 9, do
- find common variants between your dataset and the merged 1000 Genomes dataset (and filter both for these common variants)
- merge the 1000 Genomes data with your own data
- proceed to Step 10
Depending on its size, your own dataset may be divided by chromosome; so, you may have to do some pre-processing before aligning to 1000 Genomes. Either way, the population specific markers will be defined by just the 1000 Genomes dataset (Step 7). If your dataset is microarray, you'll have to pre-filter it for coding (plus / +) strand variants (Step 6).
10, Perform PCA
plink --bfile Merge --pca
11, Generate plots in R
R
options(scipen=100, digits=3)

# read in the eigenvectors, produced in PLINK
eigenvec <- read.table('plink.eigenvec', header = FALSE, skip=0, sep = ' ')
rownames(eigenvec) <- eigenvec[,2]
eigenvec <- eigenvec[,3:ncol(eigenvec)]
colnames(eigenvec) <- paste('Principal Component ', c(1:20), sep = '')

# read in the PED data
PED <- read.table('20130606_g1k.ped', header = TRUE, skip = 0, sep = '\t')
PED <- PED[which(PED$Individual.ID %in% rownames(eigenvec)), ]
PED <- PED[match(rownames(eigenvec), PED$Individual.ID),]
all(PED$Individual.ID == rownames(eigenvec)) == TRUE
[1] TRUE

# set colours
require('RColorBrewer')

# from: http://www.internationalgenome.org/category/population/
PED$Population <- factor(PED$Population, levels=c(
  "ACB","ASW","ESN","GWD","LWK","MSL","YRI",
  "CLM","MXL","PEL","PUR",
  "CDX","CHB","CHS","JPT","KHV",
  "CEU","FIN","GBR","IBS","TSI",
  "BEB","GIH","ITU","PJL","STU"))

col <- colorRampPalette(c(
  "yellow","yellow","yellow","yellow","yellow","yellow","yellow",
  "forestgreen","forestgreen","forestgreen","forestgreen",
  "grey","grey","grey","grey","grey",
  "royalblue","royalblue","royalblue","royalblue","royalblue",
  "black","black","black","black","black"))(length(unique(PED$Population)))[factor(PED$Population)]

# generate PCA bi-plots
project.pca <- eigenvec
summary(project.pca)


par(mar = c(5,5,5,5), cex = 2.0,
  cex.main = 7, cex.axis = 2.75, cex.lab = 2.75, mfrow = c(1,2))

plot(project.pca[,1], project.pca[,2],
  type = 'n',
  main = 'A',
  adj = 0.5,
  xlab = 'First component',
  ylab = 'Second component',
  font = 2,
  font.lab = 2)
points(project.pca[,1], project.pca[,2], col = col, pch = 20, cex = 2.25)
legend('bottomright',
  bty = 'n',
  cex = 3.0,
  title = '',
  c('Population 1', 'Population 2', 'Population 3',
    'Population 4', 'Population 5'),
  fill = c('yellow', 'forestgreen', 'grey', 'royalblue', 'black'))

plot(project.pca[,1], project.pca[,3],
  type="n",
  main="B",
  adj=0.5,
  xlab="First component",
  ylab="Third component",
  font=2,
  font.lab=2)
points(project.pca[,1], project.pca[,3], col=col, pch=20, cex=2.25)

Kevin
Hi Kelvin, thank you very much for your tutorial. It helps me a lot to plot the PCA-bi plot of 1kg Phrase III samples.
My question is, if I would like to plot my own sample's PCA with 1kg sample's PCA (My samples were genotyped by SNP array. There were around 700k SNPs. I want to check whether my samples came from certain ethical group), shall I directly combine the eigenvec calculated from my sample and eigenvec got from your step 10 and then plot? Can the two eigen vectors comparable?
I ask this question because in my understanding, PC is the linear combination of independent variables. In my sample, PCs are the linear combination of the pruned genotyped SNPs whereas in 1kg samples, their PCs are the linear combination of other pruned (and much more) SNPs. I doubt whether I can directly compare the PCs. If I can't compare my sample's PCs with 1kg's in this way, how can I compare the ethical group of my sample to the reference 1kg samples?
Thank you very much for your possible reply in advance.
Hey, my apologies for I seem to have missed this. It is better to combine them within PLINK and then perform PCA on the combined dataset. I have done this many times and it usually works, in the sense that sample ethnicities line up with the expected group from 1000 Genomes.
Hi Kevin,
Does the following command do a liftover of 1000 genomes to Hg19. I need to do QC on 1000 genomes data before using for LD clumping and as I haven't done this before, I'm a bit unsure. I followed your steps until this point and then proceeded to convert to plink, removed SNPs based on call rate and HWE and will then proceed to use them for LD clumping
for chr in {1..22}; do bcftools norm -m-any --check-ref w -f human_g1k_v37.fasta \ ALL.chr"${chr}".phase3_shapeit2_mvncall_integrated_v5a.20130502.genotypes.vcf.gz | \
done
Thanks
Hey, I am not sure what you mean by 'liftover' in this context (?). If you want to do LD clumping, then you just need to complete steps 1-5. This will take ~1 day, though. The imputed 1000 Genomes data is 'quite' dense.
The commands that you have pasted into your comment do the following:
bcftools norm -m-any --check-ref w -f human_g1k_v37.fasta- checks that the REF variants in the 1000 Genomes VCF files corresponds to the base in the reference genome, human_g1k_v37.fasta.bcftools annotate -x ID -I +'%CHROM:%POS:%REF:%ALT'- annotates the ID field in the 1000 Genomes VCF files to be, for example,chr1:12345645:A:Tbcftools norm -Ob --rm-dup both- the 1000 Genomes data contains duplicate variants, which have to be removed for PLINKHi Kelvin, thank you very much for your tutorial. It really helped me a lot.
I am trying to check that the 89 individuals I am working with are of European origin by comparing them with 1000 Genomes dataset. However, the data I have for my samples was obtained from targeted sequencing of 1,293 regions. My main concern is whether I have to extract only SNPs falling inside my targeted regions from the 1000 Genomes dataset before merging with my 89 samples or, whether I should use all the information from 1000 Genomes.
Thank you for your possible reply in advance.
Hey, I previously achieved this by building a predictive model from the 1000 Genomes Data and then applying it to my own data, which was also targeted sequencing. See here: A: How to predict individual ethnicity information by using hapmap data
The other way to do it is filter the datasets so that they have the same starting list of variants, and then proceed with the tutorial from part 7. For this to work, it would help if your variants are all labeled by
rs IDor aschr:bp:ref:varThanks so much for this tutorial, Kevin !!
¡De nada!, Mr Locuace
Hey Kelvin,
How to plot sub-population ("ACB","ASW","ESN","GWD","LWK","MSL","YRI", "CLM","MXL","PEL","PUR", "CDX","CHB","CHS","JPT","KHV", "CEU","FIN","GBR","IBS","TSI", "BEB","GIH","ITU","PJL","STU") in pca plot instead of "African","Hispanic","East-Asian","Caucasian","South Asian"?
Hey, you will simply have to modify the input colour vector. You will have to take great care to ensure that the colours line up to the data that is being plotted.
Hi Kevin, Just a small typo, it's actually:
gunzip human_g1k_v37.fasta.gz ;Thanks! / Obrigado!
thanks alot for this tutorial i have a vcf data file (my data)and i want to do pca how do i do that? i apologise for a naive question but i am a beginner and badly struck
With your own data, your first step should be to import it to PLINK format, and, from there, you can perform PCA immediately. In order to obtain 'population informative' variants, though, you will have to do some of the filtering steps as I do in this tutorial. Basically, you can follow the same tutorial as here.
If you want to integrate your data with the 1000 Genomes data, then it can be a bit more difficult.
Thanks alot kevin I dont have any fasta file just a vcf (freebayes) and i want to perform pca to check out similarity of my sample with other ethnic groups do i need to have a fasta file of my data?
Hello. No, you can start with the VCF. Your first task should be to convert this VCF to PLINK format and ensure that you have retained sample information in the PLINK files. Do you know how to do this? Are all of your samples from the same ethnic group?
Hello kevin I am using bcftools to normalize and annotate variants. link to my data a vcf of 10mb When i try to convert the data in bcf like the third step of this wonderful tutorial. I get an error the sequence chrM not found. The error message indicates that there are some variants on the mitochondrial chromosome but that this chromosome is either missing from your reference or annotated differently.(I am using the GRCh37 / hg19 fasta file).I have only one sample till now and the coming samples will have the same ethnicity. I want to perform PCA and see the similarity of my sample with the known ("African","Hispanic","East-Asian","Caucasian","South Asian"). can you please suggest me what to I apolosize for asking a naive question(I have just started out in this field) and my english is a so not very good so thanks alot for cooperating and helping me out.
Hello, you just need to remove the chrM variants from your input file. You can do this indirectly or directly in many different ways, such as: A: How to extract specific chromosome from vcf file
Hello kevin THANKS A LOT !!!
I remove the chroM varians from my data using the
grep -w '^#|^#CHROM|^chr[1-22]' my.vcf > my_new.vcf(I hope it keeps the header and the 22 chr I need) as other methods were either giving index error or header error.but now I get an error
Now I am getting an error that sequence "chr1" not found
link to my data https://drive.google.com/file/d/1jKaJGI0UW3lYGxmhNUdBchZzMrb8ckZ-/view?usp=sharing
I want to get the pca plot of the variants but i am getting badly struck and thanks a lot for helping me
Perhaps the header has been lost. Can you provide the output of
?
For parsing VCFs, I usually use AWK. Using grep, I would have used something like this, I think:
Hello kevin i used an editor named as em editor to change the vcf file since the annotation in the fasta file and my vcf file was different i changed my vcf file accordingly chr1 became 1 chr 2 became 2 and so on and i removed the chrM from my data, by following this method might have preserved the header the result of .
.


bcftools view -h my_new.vcfIt seems that chrM is no longer present in the file. However, your contig names are just 1, 2, 3, 4, but the BCFtools norm command is searching for 'chr1', 'chr2', etc. It is looking for these due to the fact that these are the contig names used in human_g1k_v37.fasta.
To be honest, the use of this part is not necessary:
--check-ref w -f human_g1k_v37.fastaYou can just exclude it and use:What are the contig names in the 1000 Genomes data that downloaded? - you can use the BCFtools view -h command again.
Hello
` result : chrM not found error After removing the chrM the same command gave :chr1 not found error Then i edited the vcf file changed the chr1 into 1 and so on I now get the error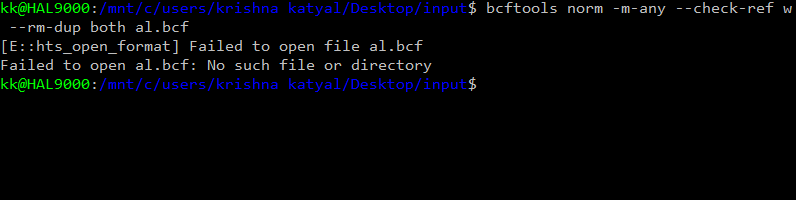
I have tried everything i altered my vcf according to the fast but still i am not able to get the bcf file. Is there another way to do ethnicity regagrding pca?
THANKS ALOT ! I wish for your best health keep safe
So I have some (probably hispanic descent) tumor WGS samples in red dots on my PCA plot projected onto 1kg data like in this tutorial (btw thank you Kevin Blighe for pointing me to this tutorial), and I am wondering how closely can we expect unknown samples to follow any given 1kg clusters. My red dots, although we believe they are hispanic, seem to form a group all of their own, which could be because they all have the same cancer, but I would have thought they should cluster more closely with the AMR super-population, no?
Is there a way to verify how accurate my PC projection is?
Hey, looks like you at least got through the tutorial successfully - it can be difficult, particularly when overlaying your own samples. From my experience, and I have done this a good few times, one's own samples can align quite well with the 1KG samples, once you have done the preparatory work correctly.
The AMR (Ad Mixed American) group is clearly the most diverse in the cohort, but it is sampling from quite a diverse pool:
[ https://www.internationalgenome.org/category/population/ ]
There's a potential that those (your) samples could be verging into the African group, too. I have also seen Brazilian samples group in that region, previously.
If I were you, I would check PC1 vs PC3, too, as the AMR group should separate out on its own plane along PC3.
It does genuinely work very well, though. I built a predictive model from the eigenvectors previously, and made predictions on samples of known and unknown ethnicity. The model had >99% sensitivity and specificity - A: How to predict individual ethnicity information by using hapmap data
Hi, Kevin. Do you know why this post is not showing the replies? It says it has 10 replies, but it appears empty on my end.
Yes, I deleted the post in order to avoid offending anybody hyper-sensitive to the topic of genetics and ethnicity.
Oh, I see... If you happen to have this at hand, would mind sharing privately? my e-mail is

Não acho que ainda tenho isto cara. Basicamente, faço o PCA como eu faço aqui nesta pagina com o 1000 Genomes Phase III. Depois, uso os eigenvectors em um modelo através de glm de forma
glm(ethnicity ~ PC1 + PC2 + PC3 ... PCn), e faço modelagem usandopredict()com amostras novas. Para selecionar os eigenvectors, faço o 'stepwise regression' (https://www.statology.org/stepwise-regression-r/). ValeuValeu, estava interessado mais no tipo de modelo mesmo, então foi um glm com stepwise. Obrigado :)
hello i want to plot an pca just like u but with my data can you give me some advice on what to do?
Hi, I need to see examples of your data and understand what you currently have. Otherwise, I cannot do anything.
hello kevin i also want to merge my data(data of 10 persons) with the 1000 genome data and want to plot a pca like the one above.the categories will be the existing ethnicity 'Population 1', 'Population 2', 'Population 3', 'Population 4', 'Population 5' and a label "my data" the plot will contatin pca of 1000 genome data along with my points (my samples). similar in the manner the user omg what i am doing has done. what i have to do can you please advise me.
I think that you basically repeat the process (above) independently for each dataset. When you come to step 9, however, there will be a few different steps:
I have now added these extra steps to the main tutorial.
hello i get this error at step 4
Hello. Can you confirm that every step prior to Step 4 has completed successfully?
yes every thing else was successfully completed
Are you sure? - I see no proof of that in your screenshot. What is the output of
hello kevin !

is there is some thing wrong with my computer ? i can also screen share with you or send u my data if i will help you to help me i have 10 individual vcf samples and want the pca plot with my data labeled as "our data" thanks alot kevin fr your support and help..i relly appreciate your efforts!! stay safe and stay healthy
It looks like your BCF files have not yet been created. You need to re-run Step 4 (above)
Hello kevin
every step prior to Step 4 has completed successfully as you can see when i run ls -l command all the files are successfully downloaded
When i run step 4 i get this error
If you run the commands exactly as they appear in the tutorial, there should not be a problem. Can you confirm the shell that you are using.
Also, next time, can you show the value of:
...and also paste the full command that you are using. When I say 'paste', can you paste the text here.
thanks a lot Kevin for helping me
ls -l | headgives this outputHi! So, you still need to re-run Step 4. It has evidently not completed successfully due to the fact that there are no BCF files.
hello kevin i apologies for taking your time but i followed every thing you can see that all files were downloaded every thing worked till step 3 but command at step 4 was not able to execute you can check as i have attached screen shot please let me know what i can do.
Thank alot kevin
stay safe
I am in good health. I trust that you are, too. Espero que estés bien.
If you run this, is there a different error message?
Was this resolved?
Hello 17bcs030,
Please refrain from using instant messaging/SMS jargon such as "fr", "u", etc. on professional and scientific forums. Write in complete sentences and use professional language.
I will try not to use these jargons i will use complete sentences and use professional language only, My sincere apologies
Hi Kevin, thank you for your tutorial. I want to merge my own data with 1kg and plot PCA-bi plot, I have some questions for these: Q1:In "step7, Prune variants from each chromosome", why don't you exclude long high-LD regions? Isn't that necessary?
Q2: 1)a. Prune 1kg and my own dataset respectively ; b. Merge the two datasets 2) a. Merge the two datasets; b. Prune them Is there a difference between the two strategies?
Q3: Does 1kg data need to be quality control? e.g.: --geno --mind --maf
Q4: I‘m not very clear about this command: --indep 50 5 1.5 , if I removed same individuals or variants from my data, Do I need to regenerate a *prune.in file ? Thank you for your time in helping me with these questions.
Hey,
You can do that. Actually, pruning for LD is performed via the
--indepflag (see your question 4)Yes, there is a difference, and one will obtain different results depending on the order of these operations. I have not tested which order is preferential over the other.
It is already of good quality from source. However, in this tutorial, I provide a normalisation step to split multi-allelic calls in step 4.
This is pruning based on LD. More information here: https://www.cog-genomics.org/plink/1.9/ld
It would be altered if samples were removed - yes.
Hi Kevin, thanks for your explanation. I was reading this comment and tried myself. For the Q2 if I prune 1kg and my dataset respectively first, I will have much fewer SNPs overlapped when merging. So I guess we should merge first and then prune? Can I directly merge my unpruned dataset to pruned 1kg (this way still only pruned SNPs are used)?
Hi Kevin Blighe, thanks for this incredible tutorial! I was wondering: having obtained the plink.eigenval and plink.eigenvec files using plink's --pca function, is there an objective way of identifying how many population covariates should be included in downstream genetic analyses (e.g. generation of polygenic risk scores or eQTL work)? I am following this other post, but I am not sure I understand what's this objective way. Should I analyse PC 1 by 2, 2 by 3, 3 by 4, 4 by 5 and so on, until I find a normal distribution? Is there a "numeric" score per PC that could be useful to make this more objective (e.g., include only principal components as covariates if they are associated with eigenvalues > 1.5?). Any clarification on this would be much appreciated!
Also, plink automatically calculates 20 PCs. If I ask plink to calculate 10 PCs, will the first few PCs be different between the two different runs (when I asked plink to calculate 10 vs when it calculated 20)? I'll be testing this later on so I can answer this one in a while - I am assuming that values will change.
Finally, if I have a variable like "genotype chip name" (samples from different institutions were genotyped using a different SNP chips), is this something I can include as a factor in the calculation of my PCs? (Or is this something that will drive the PC values I obtain anyway, so no need to do this?)
Muito obrigado, caríssimo!! And I am sorry if these questions are too basic.
Boa tarde! Some people just inspect the bi-plots and make a decision about PCs to include (as covariates) in that way. In my opinion, however, it is better to regress the PCs against
population, and then retain the statistically significant PCs as covariates. For example:, or:
The values to use for the PCs should be in the eigenvec file (?). The PCs to retain are those that pass p<0.05.
I am not sure, but I I think that the first 10 will always be the same.
This is likely a
batchcovariate, yes, and it may be altering the PCA calculations. The biggest worry is that the different chips / arrays may be genotyping different SNPs, or different strands (coding / non-coding; plus / minus) of the same SNP. Some upstream pre-processing (before PCA) should be performed to ensure alignment across the different chips, I think.Hello Kevin, I´m sorry for bothering you. I´m trying to convert 1000 genomes vcf file (ALL.chrX.phase3_shapeit2_mvncall_integrated_v1b.20130502.genotypes) to plink format and merge it with my in-house dataset (already in plink format) so I can perform admixture analysis and maybe PCA also. I would need to follow all the steps you detailed here? What would be the problem if I just do the conversion of the vcf with plink --vcf ALL.chrX.phase3_shapeit2_mvncall_integrated_v1b.20130502.genotypes --out cromX1KG ? I would be very gratefull with your clarification!! Iriel
Hey, no problem. In this tutorial, I do not focus on any allosome (chrX or Y); however, the data is available at the FTP sites:
Yes, you can follow some of the steps here in order to merge your data with the 1000 Genomes chrX data, primarily Steps 4 + 5, and then follow advice Here
Thanks for the answer! I will try to follow your instructions. Iriel
De nada! There is technically no right or wrong way in which to merge the datasets. The 'merge' can occur at different stages of processing. Also, you may not want to do, for example, Step 7, from my tutorial above.
Hi Kevin, I have tried steps 4 and 5 of your tutorial on chromosome X vcf from 1000 genomes, then I filtrate my in house dataset of chromosome X SNPs to only keep SNPs on the + strand (according to Illumina microarray files). I also found the common SNPs using the intersect function from R and extracted those common SNPs from each dataset.
The problem comes out when I try to merge both datasets with plink
Plink throws an error saying that there are several variants with 3+ alleles present, that this could be due to strand inconsistency.
I think I should do the same selection of + strand genotyped SNPs in 1000 genomes dataset, do you have any command to do that?
Thanks in advance for your answer!
Yes, you would need to filter the 1000 Genomes dataset for these coding (+) strand variants too. I believe the PLINK flag to do this is
--excludeHola kevin gracias por un tutorial tan maravilloso
I have my few sample files and I want to merge them with the 1000 genome and want to perform the PCA.
I followed your great tutorial but I get an error at step 4. I am using bcftools 1.3 and I have performed all steps 1,2,3.
Here you can see I have downloaded all the 1000 genome files along with the reference fasta
When I run the Step 4 I get this error
When I run this:
I get bcf for chr1 only that too incomplete(few bytes in size), if I replace
chr1withchr2I again get the same segmentation errorI am using a laptop with 16 GB of ram. I am badly struck. thanks a lot for your help
Mantente seguro
DIOS TE BENDIGA, REZO POR TU BUENA SALUD
Please do not paste screenshots of plain text content - it is counterproductive. Use GitHub gists to show us the actual text content instead. See this post on how to use GitHub gists: A: How to Use Biostars Part-3: Formatting Text and Using GitHub Gists
greetings Thanks alot for your valuable suggestion i will make sure to follow the method you have prescribed
Hi, you seem to be using two accounts: krishnakatyal5121 and 17bcs030
Please do not do this. Stick to one account. Send an email to the administrator (admin at biostars dot org) and request that your accounts be merged.
Greetings I have mailed the administrator,If I have caused any incoviniance I ask for apologies. Thanks alot , I request if you could help me with my problem.stay safe
Greetings,
I am a complete beginner. I was trying to perform step 1, but got stuck. Get the following output where it says, NO SUCH FILE, this is for all chromosomes...Hope someone will explain what i have done wrong.
Thanks
Lax
Hi Lax,
I just tried this and got the same error as you when typing in the tutorial commands as written. If you go to the ftp url from the prefix in your browser, (http://ftp.1000genomes.ebi.ac.uk/vol1/ftp/release/20130502/), you'll see that the file names are slightly different: version b instead of version a as written in the original tutorial (e.g. ...integrated_v5b.20130502...). When I updated the suffix text, the download worked for me.
Rewritten step 1 with updated file name suffix:
Hope this helps!
Hi Kevin I have used the
--make-pgenflag which give me .pgen, psam, and pvar, after that I used pca command and got .eigenvec and .eigenval. I want to draw a plot using R but the script here used PED. how can I plot in R for Psam, pvar and pgen?Hi,
--make-pgenjust creates a binary dataset. Can you not recode this as plain text PED? Sorry, I am tired and will check back in the morningIt comes across as a bit rude to paste some errors and provide no commentary - sorry.
By having
Rthere, I am invoking the R environment for you, i.e., you typeRat your command prompt in order to load R.Regarding the other errors, please show the first few lines of
eigenvecsorry, my understanding is very low in bioinformatics and I want to plot the PCA graph using Rstudio. i have used plink for the generation of pca. i have virus vcf file of SNPs which I converted to .psam, pvar, and pgen. after that i use PCA command and finally got two file eigenvec and eigenv. after that i put the script in Rstudio that you provide in the tutorial.
I HAVE to try it with both typing the R and without typing the R in the command prompt still show error.
I only added the R there to indicate that you then need to move from the shell command prompt to the R environment. In your case, you just need to move to RStudio.
which library is need to plot PCA graph in R. ggplot, tydiverse
You just need base R functions. I am guessing that your input data is different, for some reason. How did you generate the plink.eigenvec file? - please show the first few lines from it.
below is the Ist lines of plink.eigenvec
Hi, I got an error when running ‘gunzip human_g1k_v37.fasta.gz’ in step 3. The error message is 'unexpected end of file'. Is the file damaged? Thank you.
Can you confirm that the download completed?
It shows that it is done. Is the compressed file 115 KB? By the way, when I used a decompress software, although it showed that the file cannot be extracted properly, there was an output file. In the output file, there are many rows consisting of N after the first row, and then comes T, A, C, G. Is it normal? I am afraid that the file has some differences compared to the original one.
No, human_g1k_v37.fasta.gz is just a gunzipped version of the hg19 reference genome; so, ~900MB in size. Can you see it by going here: http://ftp.1000genomes.ebi.ac.uk/vol1/ftp/technical/reference/
For the record, I have an encoding algorithm that can 'zip' this genome to below that of 2bit.
Yes, I can see the file. But when I downloaded it, the download just finished when the file size is 115 KB.
Please check available disk space, etc. Apologies if you have already done this.
Hi Charles, I am having the same issue. Do you manage to solve it?
Can you please show the complete output after you have run:
This seems to be a Ubuntu issue. I used Mac to do wget and gunzip. It output
but also the human_g1k_v37.fasta. I can proceed with the fasta without problem.
Okay, that is strange. I just tried wget (Ubuntu 16.04) and my connection was refused. I am now trying with curl and it seems okay.
Hi Kevin, thank you for this tutorial! I am following along to combine my own microarray data with 1000G for downstream analyses.
Would it be possible for you to expand on the reason for Step 6 (excluding variants not on the coding strand). I'm wondering why this step is necessary if I have aligned both the microarray data and 1000G data to the same reference genome.
Thank you in advance for explaining further.
Hi Olivia, we need Step 6 when using array data due to the fact that array probes can target the sense (coding) or non-sense (non-coding) strands, whereas NGS (used by 1000 Genomes) only sequences the coding strand. Integrating array data with the 1000 Genomes dataset can be tricky - I hope that you manage to do it.
Hi Kevin,
Thank you for such a comprehensive tutorial. I am using 1K data in build 38. While using R to draw the plots, I do not have any individuals left in the PED file. It comes as NA instead of TRUE. I have tried to search a different pedigree file but have not found one. Any suggestions are appreciated.
Hi, there's not much that I can do to help, right now. You have not shown any code or examples of input data.
Hi Kevin,
I am using the R script you have shown above to draw the plots.
Well, the problem is in the code chunk, #Read the PED file. Can you re-check that you have copied my code directly? I can already see that one of your lines is misplaced (out of place).
You will know that it is functioning correctly when this line returns
TRUE:Thank you. That is true. However, the code is the same as yours and I still get NA. Manually comparing, I see that there are no common individuals in these two files (the ids are different in the fam file of 1K in build 38 and the ped file). That is why, I was wondering whether there is another PED file for build 38 that I am not able find.
Please use
ADD REPLYwhen responding to existing posts. Do not add comments as new answers to this thread.I have not looked in depth at the hg38 data, unfortunately. The participant IDs should be the same [I would hope...]. Can you show an example of how the IDs appear in
plink.eigenvec?Hi Kevin,
Thank you so much for this nice explanation !! I followed your steps for 1000 genomes GRCh38 aligned data and got exactly the same nice PCA plot. Wonderful!!
I am doing the same thing as you, my data is also GRCH38, can you please provide your code conveniently? Or where can I find the population information of GRCH38?I can't find the ped file
Hi Kelvin my data version is GRCH38,but I see your Note 3 GRCh38 data is available HERE,where is the 1000 Genomes PED file,I do not find it thank you
Hi, the PED file should be independent of the reference genome build.
Hi, Thanks for the useful and applicable tutorial, I do not have access to input for "eigenvec" file .
Could you please show us an input file for the "11, Generate plots in R" part. I used .pca.evec file from eigensoft, the input is like:
But the codes that you mentioned above are not ok, I would be grateful if there are some advice?
Hi, the eigenvec file should have columns:
However, the header line is actually missing.
Thanks, I am sorry for subsequent comments, I'm trying the below codes
Just one question. I need the variants to have either the
rsID(when it was in the VCF) or thechr:bp:ref:alt(when norsIDwas present in the VCF).Like this:
So, would this work in the command
'chr%CHROM\:%POS\:%REF\:%ALT'?Hi Kevin, thanks for the wonderful tutorial. I managed to create a very similar plot using 1000GP3 hg19 data, but I get a strange split in the data PC1 vs PC3 plot (not particularly noticeable in the PC1 vs PC2 plot) for each population when generating the same plot using hg38 data is this normal, or do you think I am doing something wrong?
1000GP3 hg19 dataset: 466436 variants and 2504 people pass filters and QC.
1000GP3 hg38 dataset: 422864 variants and 2548 people pass filters and QC.