Entering edit mode

5.3 years ago
Grace_G
▴
20
Hello,
I got the read counts matrix of sample after RNA-Seq htseq-count, for this read counts matrix, rownames are gene id, colnames are sample id(format, organ_gender_age),then use PCA to find correction of samples, but how to each covariate(organ, gender, age) with PC loading???
Any recommend way here? Thank you in advance!
PCA tutorial by @Kevin : PCA plot from read count matrix from RNA-Seq
Thanks, but not have covariate with PC loading part.
Do you have a file phenotype data? This file should include the name of your samples, conditions and any other information such as batch etc. You can use that and perform a PCA analysis in R. Make sure your counts are normalised!
Thanks for your view! But a file phenotype data is used for DEseq2, isn't it? Here for PCA not use DEseq2, since all these phenotype data are used for describing samples, so I combine them as sample ID directly, so sample ID can show all of them.
read counts matrix like:
after t(matrix) and normalise can do pca use function, but still I wander it can get PC loading for each covariate?
You're looking for "factor analysis", which is related to PCA but not exactly the same.
Thanks Ryan, glad to hear from you! I'm not sure, also not sure what as the input data, actually just want to see like pc1 or pc2 or pc10 loading age (and other covariates) most. But seem's rare PCA material about this, I'm seeking some package to do since now I also not sure the format of input data.
What are you actually trying to do? This sentence is not clear:
Yes, it like sometimes we hope wild type samples together and mutant type sample together on the PCA plot. Here I hope same organ sample together on PCA plot, this is what I mean "correction of samples". But after draw this plot, we want to know each covariate(organ, gender, age) with PC loading next, and this step I don't know how to do it.
Can you show the plot that you have, currently?
Sorry, I afraid I can't, actually it's general.
So you want something like the following but with the length of each arrow indicated?
Thanks! I guess it's colnames(sample id) are honey, winey, body,...and my are liver_female_2 heart_male_6 lung_female_3 liver_female_1..., organ's loading(liver, heart, lung), gender's loading(female, male), age's loading(2,6,3,1). The requirement for me is to get correlate every covariate (e.g. age, gender, organ) with top6 PC loadings.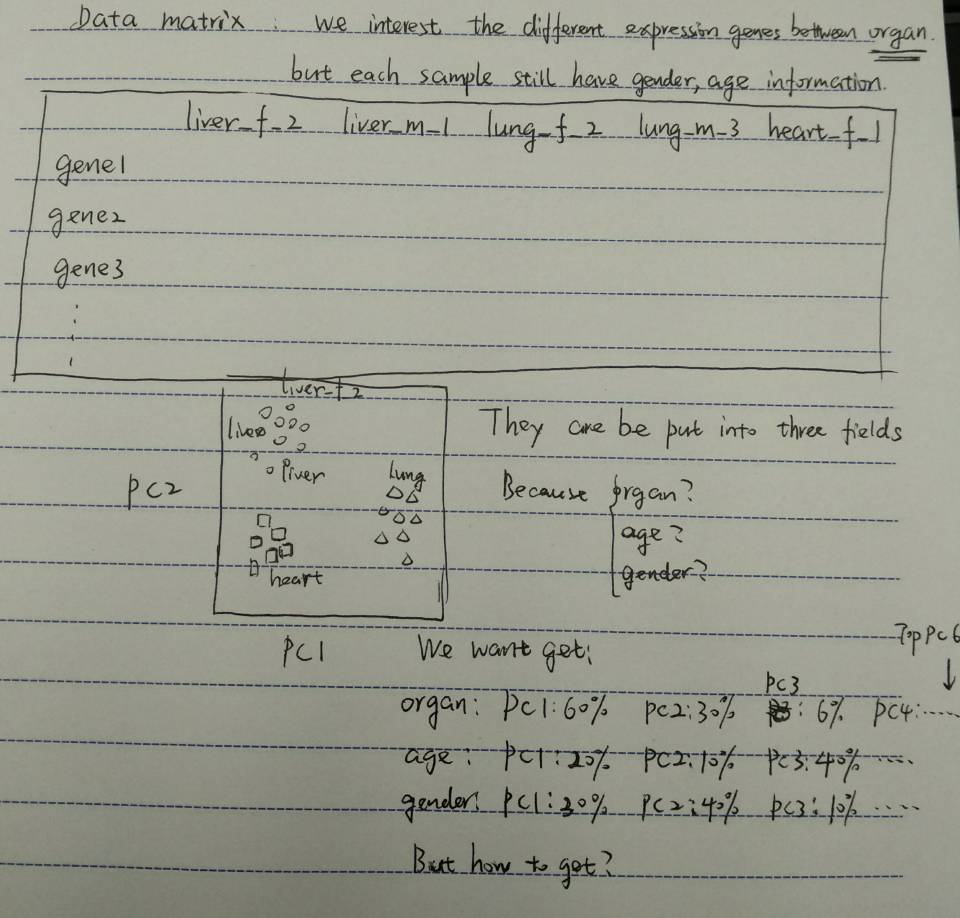
Have a look at the FactoMineR package.
Seems very possible, many thanks for your time Ryan!!!
hi, Ryan! Maybe the following related, however, it is really a good doc, so I share here.