Entering edit mode

5.3 years ago
Pin.Bioinf
▴
340
Hello,
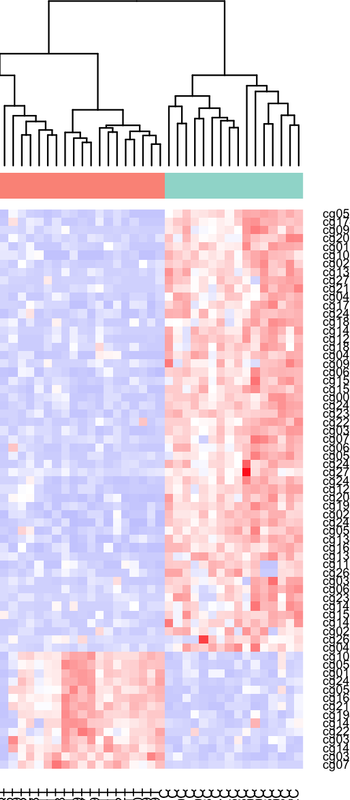
I have plotted my methylation beta-values of 1000 CpGs in tumor-controls. The heatmap seems ok at first glance, but I see that some CpGs that are differentially hypomethylated in controls appear as hypermethylated in controls in the heatmap. Is this because of the z-score scaling? Should I convert to M values first? Thank you.
EDIT: Here is some code:
Matrix (only an example of the big matrix):
            SAmple1C  Sample2T  Sample3C   Sample4T  Sample5C   Sample6T
cg03185752   0.03128   0.06667   0.00079   0.13409    0.01614    0.00000
cg26222311   0.10023   0.00000   0.08416   0.00000    0.04864    0.00000
cg13488570   0.30099   0.06393   0.29301   0.02862    0.39648    0.00343
Code:
heatmap.2(Matrix,scale='row',col=bluered(149),trace='none',
main = "Centered CpG sites",ColSideColors=rep(c(col1[1],col1[4]),19),margins = c(9, 22),density.inf="none",symkey=TRUE)

legend("topright", title = "Samples",legend=c("Control","Tumor"),
       fill=c(col1[1],col1[4]), cex=0.8, box.lty=0)
Result:
Share some code, so we can see what you're doing.
I just edited thanks.
The
heatmap.2function usesscale = "none"as default. If you find hypermethylated values, as hypo in your heatmap, you probably made a error before the z-score conversion. Maybe switched control with treatment group somewhere?What I expect to see is all hypomethylated tumors, no hypermethylated tumors, which makes sense in most of the heatmap, but at the bottom there is an inverse behaviour : hypermethylated tumors and hypomethylated controls. the DMPs calculation results in those CpGs show hypomethylation in tumor, so the heatmap should reflect the same thing in those cpgs right? or are z scores messing with it?
I don't see any code making z-scores, so I cannot judge if they are messing with it or not...
I thought scale='row' did the transformation to z-scores? that is all i am doing, introducing a beata value matrix into heatmap.2 function and setting scale to 'row'
Right, I overlooked
scale='row'in your code, that's why I was talking about default setting. Try to make your own z-scores first, and than make aheatmapwithscale='none', see if it looks better.