how to generate CNV plot from VEP results
1
0
Entering edit mode
5.5 years ago

Hi all, I want to visualize my copy number alteration results following annotating with Variant Effect Predictor (VEP) as a CNV plot.

The input of VEP had been generated by RgenomicRanges package in R. I found several significant deletions or duplications (qvalue<0.2)

Here is what I obtained from VEP:

#Uploaded_variation Location    Allele  Consequence IMPACT  SYMBOL  Gene    Feature_type    Feature BIOTYPE EXON    INTRON  HGVSc   HGVSp   cDNA_position   CDS_position    Protein_position    Amino_acids Codons  Existing_variation  DISTANCE    STRAND  FLAGS   SYMBOL_SOURCE   HGNC_ID TSL APPRIS  SIFT    PolyPhen    AF  AFR_AF  AMR_AF  EAS_AF  EUR_AF  SAS_AF  AA_AF   EA_AF   gnomAD_AF   gnomAD_AFR_AF   gnomAD_AMR_AF   gnomAD_ASJ_AF   gnomAD_EAS_AF   gnomAD_FIN_AF   gnomAD_NFE_AF   gnomAD_OTH_AF   gnomAD_SAS_AF   CLIN_SIG    SOMATIC PHENO   PUBMED  MOTIF_NAME  MOTIF_POS   HIGH_INF_POS    MOTIF_SCORE_CHANGE
11_66333072_deletion    11:66333071-66333838    deletion    coding_sequence_variant,intron_variant,feature_truncation   MODIFIER    CTSF    ENSG00000174080 Transcript  ENST00000310325 protein_coding  5/8/2013    5/8/2012    -   -   755-?   645-?   215-?   -   -   -   -   -1  -   HGNC    2531    -   -   -   -   -   -   -   -   -   -   -   -   -   -   -   -   -   -   -   -   -   -   -   -   -   -   -   -   -
11_66333072_deletion    11:66333071-66333838    deletion    coding_sequence_variant,intron_variant,feature_truncation   MODIFIER    CTSF    ENSG00000174080 Transcript  ENST00000524994 protein_coding  3/6/2009    3/6/2008    -   -   187-?   189-?   63-?    -   -   -   -   -1  cds_start_NF,cds_end_NF HGNC    2531    -   -   -   -   -   -   -   -   -   -   -   -   -   -   -   -   -   -   -   -   -   -   -   -   -   -   -   -   -
13_50135463_deletion    13:50135462-50141345    deletion    coding_sequence_variant,intron_variant,feature_truncation   MODIFIER    RCBTB1  ENSG00000136144 Transcript  ENST00000258646 protein_coding  1/2/2011    1/2/2010    -   -   115-?   71-?    24-?    -   -   -   -   -1  -   HGNC    18243   -   -   -   -   -   -   -   -   -   -   -   -   -   -   -   -   -   -   -   -   -   -   -   -   -   -   -   -   -

I also tried to perform copy number alteration analysis on TCGA data using Gistic 2.0 in GenePattern. However stragely no amplification or deletion were detected.

Can you tell me why I did not get significant results when running gistic 2.0.

Regards

Nazanin

copy number alteration VEP CNV plot • 8.2k views
ADD COMMENT
1
Entering edit mode
ADD REPLY
0
Entering edit mode

VEP and GISTIC are apple and orange, IMO. Not clear how the analysis is done. Did you try other CNA tools using CBS or Haar algorithms?

Do you have an example image for Deletion depiction?

ADD REPLY
0
Entering edit mode

This is the link: https://postimg.cc/yDv16Z8q

ADD REPLY
0
Entering edit mode

Nazanin, as I understood from the previous question, you only wanted to use VEP for the purpose of annotating the regions. VEP is usually the end-point in an analysis, i.e., the final step.

Going back to this step: C: Annotation of huge number of CNV files

Were you ever able to run that command (runGAIA()) successfully? It will likely not work on any personal computer because it is too compute intensive.

ADD REPLY
0
Entering edit mode
ADD REPLY
0
Entering edit mode

Yes Kevin, you're right.

If you remember after getting the result of copy number analysis I tried to run biomaRt as you suggested to me. However I could not run it properly so I decided to use VEP instead. I have access to server right now, however I am a little confused about how I can generate a custom CNV plot to represent in my paper.

I tried to re-perform the analysis using gistic 2.0 on Genepattern, however no significant results was generated. This made me more confused.

ADD REPLY
0
Entering edit mode

Can you possibly retry the annotation step with biomaRt? The exact steps are here: A: How to extract the list of genes from TCGA CNV data

The previous thread became too long...

ADD REPLY
0
Entering edit mode

Sure. I will rerun biomaRt on Monday and let you know at which step I got the error message. I think the source of problem is what I introduce to biomaRt as input.

Thank you again

ADD REPLY
0
Entering edit mode

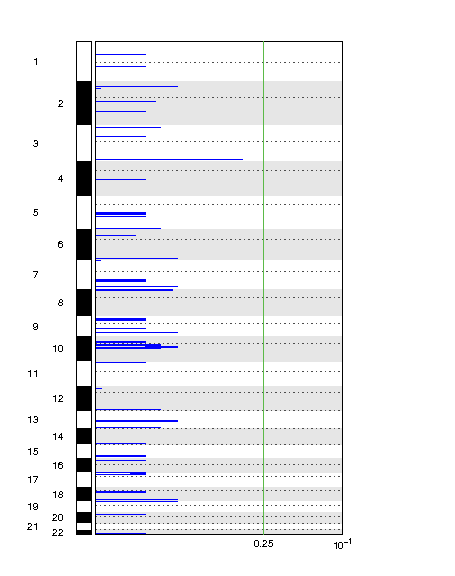
I have also just posted an answer below, showing how you can plot output from runGAIA. Let me know if it works.

ADD REPLY
0
Entering edit mode

If you need me to process the data for you on my servers, then I will do that - no problem. Just point me to which Firebrowse data you are using. You can contact me in private, if you wish.

ADD REPLY
0
Entering edit mode

Sure Kevin.

I will inform you on Monday.

ADD REPLY
0
Entering edit mode

Hi cpad, the original thread had dragged on, here: C: Annotation of huge number of CNV files

ADD REPLY
0
Entering edit mode

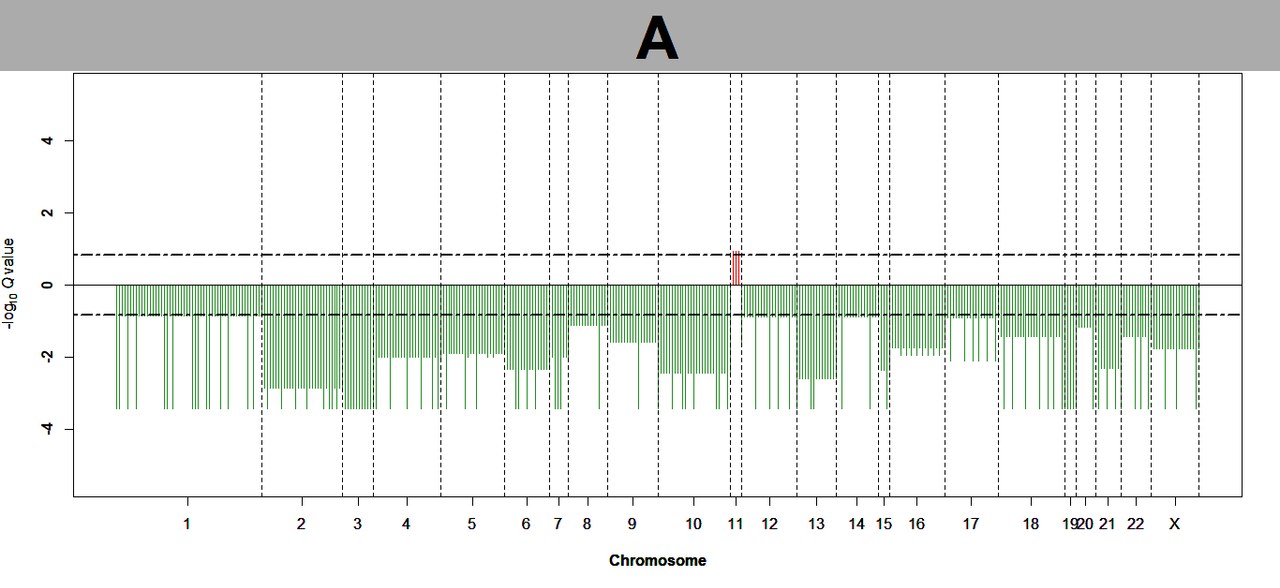
Hi @Kevin Blighe I am getting a similar plot like this one, all commands seem to run without any errors, exactly same steps followed form part I, part II and part III. Could you help with it? enter image description here

Thank you

ADD REPLY
0
Entering edit mode

Do not add answers unless you're answering the top level question. "I have this problem too" comments should be comment-replies on appropriate posts, not answers. I've moved your post to a comment for now, but please be more careful in the future.

ADD REPLY
7
Entering edit mode
5.5 years ago

Credits to Tiago Silva; https://f1000research.com/articles/5-1542

Ignording VEP, with output from runGAIA(), which identifies recurrent somatic copy number alterations (sCNAs), you can generate a plot like this:

  • Part I - download segmented sCNA data for any TCGA cohort from Broad Institute's FireBrowse server and identify recurrent sCNA regions in these with GAIA

  • Part II - plot recurrent sCNA gains and losses from GAIA

  • Part III - annotate the recurrent sCNA regions (this post, just below)

  • Part IV - generate heatmap of recurrent sCNA regions over your cohort

Part II

run runGAIA

results <- runGAIA(cnv_obj, markers_obj, output_file_name="Tumor.asian.txt", aberrations=-1, chromosomes=-1, num_iterations=10, threshold=0.15)

tidy output

#Set qvalue threshold for plotting and annotation
threshold <- 0.15

#Convert the recurrent aberrations to numeric (GAIA saves it as text)
RecCNV <- t(apply(results, 1, as.numeric))
colnames(RecCNV) <- colnames(results)

#Add a new column for 'score'
RecCNV <- cbind(RecCNV, score=0)

#Determine the minimum Q value that's not equal to 0
minval <- format(min(RecCNV[RecCNV[,"q-value"]!=0, "q-value"]), scientific=FALSE)
minval <- substring(minval,1, nchar(minval)-1)

#Replace Q values of 0 with the minimum, non-zero value
RecCNV[RecCNV[,"q-value"]==0, "q-value"] <- as.numeric(minval)

#Set the score to equal -log base 10 of the Q value
RecCNV[,"score"] <- sapply(RecCNV[,"q-value"], function(x) -log10(as.numeric(x)))

create plot function

#Create a function for plotting the recurrent copy number variants
gaiaCNVplot <- function (calls, threshold=0.01, main="main") {
    Calls <- calls[order(calls[,"Region Start [bp]"]),]
    Calls <- Calls[order(Calls[,"Chromosome"]),]
    rownames(Calls) <- NULL
    Chromo <- Calls[,"Chromosome"]
    Gains <- apply(Calls,1,function(x) ifelse(x["Aberration Kind"]==1, x["score"], 0))
    Losses <- apply(Calls, 1,function(x) ifelse(x["Aberration Kind"]==0, x["score"], 0))
    plot(Gains, ylim=c(-max(Calls [,"score"]+2), max(Calls[,"score"]+2)), type="h", col="red2", xlab="Chromosome", ylab=expression("-log"[10]~italic(Q)~"value"), main=main, cex.main=4, xaxt="n", font=2, font.axis=2, font.lab=2, font.axis=2)
    points(-(Losses), type="h", col="forestgreen")
    abline(h= 0, cex=4)
    abline(h=-log10(threshold), col="black", cex=4, main="test", lty=6, lwd=2)
    abline(h=log10(threshold), col="black", cex=4, main="test", lty=6, lwd=2)
    uni.chr <- unique(Chromo)
    temp <- rep(0, length(uni.chr))

    for (i in 1:length(uni.chr)) {
        temp[i] <- max(which(uni.chr[i] == Chromo))
    }

    for (i in 1:length(temp)) {
        abline(v = temp[i], col = "black", lty = "dashed", )
    }

    nChroms <- length(uni.chr)

    begin <- c()

    for (d in 1:nChroms) {
        chrom <- sum(Chromo == uni.chr[d])
        begin <- append(begin, chrom)
    }

    temp2 <- rep(0, nChroms)

    for (i in 1:nChroms) {
        if (i == 1) {
            temp2[1] <- (begin[1] * 0.5)
        }
        else if (i > 1) {
            temp2[i] <- temp[i - 1] + (begin[i] * 0.5)
        }
    }

    uni.chr[uni.chr==23] <- "X"
    uni.chr[uni.chr==24] <- "Y"

    for (i in 1:length(temp)) {
        axis(1, at = temp2[i], labels = uni.chr[i], cex.axis = 1)
    }

    #legend("topright", y.intersp=0.8, c("Amplification"), pch=15, col=c("red2"), text.font=2)
    #legend("bottomright", y.intersp=0.8, c("Deletion"), pch=15, col=c("forestgreen"), text.font=2)
}

plot data

gaiaCNVplot(RecCNV, threshold, "A")

h

Kevin

ADD COMMENT
1
Entering edit mode

Hi Kevin,

Thank u so much for the code. It worked for me today.

I have two more questions now:

1- how can I get a plot like this, with the name of genes

2- when I run the "rungaia" command I got two files in my folder. One with name:"Tumor.All.txt" and other one:"Tumor.All.txt.igv.gistic"

I want to know which one of these two files must be introduced in biomaRt? I want to know what is "df" in your code.

I would be grateful if you advise when you have free time. I don't want to interrupt you.

Nazanin

ADD REPLY
1
Entering edit mode

Hello, that's great! For biomaRt, you should use this file: Tumor.All.txt.igv.gistic

ADD REPLY
0
Entering edit mode

Hi Kevin, I am suspected to my results. This is the header of the out put (GISTIC file) of GenomicRanges package:

Type    Chromosome  Start   End q-value G-score
Del 1   61808   4364407 1   0
Del 1   4364472 4364634 0.49383 0
Del 1   4366964 5706597 1   0
Del 1   5707162 5707499 0.49383 0
Del 1   5707515 168083007   1   0
Del 1   168089111   168091414   0.49383 0

All G-scores are 0. Does it mean that the aberration of none of genes have been observed frequently across samples?

I imported this file to biomaRt for annotation. In this line of code (colnames(CN) <- c("Barcode", "chr", "start", "end", "extra1", "extra2") ), the column q-value gets the name (extra 1) and G-score gets (extra 2).

This is the output of biomaRt:

    extra2  chr extra1  AberrantRegion  GeneRegion
793 0   1   1   Amp:61808-249224388 OR4G11P:1-62948
793.1   0   1   1   Amp:61808-249224388 MTATP6P1:1-569076
793.2   0   1   1   Amp:61808-249224388 SAMD11:1-860260
793.3   0   1   1   Amp:61808-249224388 MIR200B:1-1102484
793.4   0   1   1   Amp:61808-249224388 UBE2J2:1-1189289
793.5   0   1   1   Amp:61808-249224388 CCNL2:1-1321091
793.6   0   1   1   Amp:61808-249224388 SSU72:1-1477053
793.7   0   1   1   Amp:61808-249224388 GNB1:1-1716729

Can I consider this results meaningful?

ADD REPLY
0
Entering edit mode

I have another question.

This is the image of one of my stages:

enter image description here

As you see I have some significant aberrations in chromosomes 7, 8, 12 and 16. However in the annotation file produced by biomaRt none of these have significant q-values. Moreover several other aberrations which are not in the cnv plot have been produced by biomaRt.

Can you tell me what can be the source of this discrepancy?

ADD REPLY
0
Entering edit mode

If you run the runGAIA() command with low numbers of samples, then it will likely be difficult to find regions that have recurrent copy number alterations. The algorithm is designed to find regions that have a high frequency of copy number alteration. If you only supply 20-50 samples, then it will be [statistically] difficult to find these regions.

ADD REPLY
0
Entering edit mode

Hi nazaninhoseinkhan, I have the similar GISTIC output file as you. All G-scores are 0. so you understand what it means now?

ADD REPLY
0
Entering edit mode

Sorry, the following is the plot I meant:

CNV plot with gene names

ADD REPLY
0
Entering edit mode

Where did you see this figure?

ADD REPLY
0
Entering edit mode

I see this figure in this paper: "Comprehensive molecular portrait using next generation sequencing of resected intestinal-type gastric cancer patients dichotomized according to prognosis".

I tried Gistic 2.0 on GenePattern too. However strangely I got no genes, means no one has the qvalue lower than 0.25. That's why I suspected to my results.

ADD REPLY
1
Entering edit mode

I achieved many regions with Q < 0.25 in my recent work: Racial differences in endometrial cancer molecular portraits in The Cancer Genome Atlas. The heatmaps were drawn with ComplexHeatmap.

ADD REPLY
0
Entering edit mode

Yes Kevin, I saw the cnvplot in your paper. It is so dense. however my cnvplots are so sparse(with only few peaks). If you remember I am working on different stages of cancer (stage i-iv).

Can I send you the input data of one stage (stage i) to repeat the analysis? Before reporting the results I want to be sure that I performed the analysis correctly.

ADD REPLY
0
Entering edit mode

Sure, but, wait, which file were you originally using from Broad Firebrowse? Copy number is not necessarily a feature of all cancers, to the best of my knowledge. Also, for GAIA to function, you require a large number of samples. In the paper, we had >1000 samples, mixed between normals and tumour.

ADD REPLY
0
Entering edit mode

Hi Kevin, I have 283 stage i, 50 stage ii, 111 stage iii and 54 stage iv. They are all mixed between normal and tumor.

I want to find sequential changes occurred moving from stage i to stage iv. Is it biologically meaningful?

I am asking this question because I expected to see changes in stage i in all stages, but this was not true. I guessed that it is because the sample from stage i to stage iv do not belong to the same patients

ADD REPLY
0
Entering edit mode

Hi @Kevin Blighe i have applied the CNV plot step on"breast cancer data", but i got this plot.

Is it reasonable, if so what's the real interpretation behind this plot !!!!

SCNA_output

ADD REPLY
1
Entering edit mode

Yeh, something does not seem correct! Which data did you obtain? If ou obtained data direct from the TCGA GDC, then none of my code is valid. To use my code, you must start with the data from Broad Firebrowse.

ADD REPLY
0
Entering edit mode

@Kevin Blighe No No bro, I hope you remember me I'm the same person who asks this questions a few months ago about "A: How to extract the list of genes from TCGA CNV data"

I got my data from the same resource and this my file resources and this my file name BRCA-FFPE.snp__genome_wide_snp_6__broad_mit_edu__Level_3__segmented_scna_minus_germline_cnv_hg19__seg.seg

I follow all your steps and all of them run quite good.

However, I took the FFPE and not this file BRCA.snp__genome_wide_snp_6__broad_mit_edu__Level_3__segmented_scna_minus_germline_cnv_hg19__seg.seg because the second one is too huge and I expect that I can't done all the steps successfully as you remember because of the space issue.

Do you think if I will use the second file i will get more reliable results, because I need to add these steps in my thesis?

Plz, help me out !

ADD REPLY
1
Entering edit mode

Yes, I remember you. Can you contact me again? I have 1000s of emails.

ADD REPLY
0
Entering edit mode

@I don't have your e-mail can you give it to me plz ??

ADD REPLY
0
Entering edit mode

Dear @Kevin Blighe, here is the error when I used the second input file BRCA.snp__genome_wide_snp_6__broad_mit_edu__Level_3__segmented_scna_minus_germline_cnv_hg19__seg.seg

Breast_cancer CNV data

cnv_obj <- load_cnv(cnvMatrix, markers_obj, n)
Loading Copy Number Data
Error: cannot allocate vector of size 1.1 Gb

So, how will I continue the next steps without getting the cnv_obj!

ADD REPLY
1
Entering edit mode

Oh, you are now using the breast cancer dataset? Remember that you require a lot of memory to be able to complete that step.

Do you need me to help?

ADD REPLY
1
Entering edit mode

@Kevin Blighe Yes, bro I'm using Breast Cancer data now.

Yes, I need you to do the whole process for me including all the graphs, because I will put this work in my thesis.

I don't have enough memory to do that!

My data is from Firebrowse

  • genome_wide_snp_6 segmented_scna_minus_germline_cnv_hg19 (MD5)
  • BRCA.snp__genome_wide_snp_6__broad_mit_edu__Level_3__segmented_scna_minus_germline_cnv_hg19__seg.seg

Thanks in advance!

ADD REPLY
2
Entering edit mode

Yes, I need you to do the whole process for me

That's called outsourcing and Kevin is an expert, so I'm not sure you can afford his hourly contract rate. Plus, there might be objections your ethics committee might have about outsourcing your thesis.

ADD REPLY
0
Entering edit mode

@RamRS You really misunderstood me! Thanks anyway.

ADD REPLY
0
Entering edit mode

That is definitely possible. Would you care to explain what you mean by the "I need you to do the whole..." part then?

ADD REPLY
0
Entering edit mode

@RamRS I mean can you run the source codes you mention about my previous questions in your computer bcz my computer stopped running after in step2 due to the memory issue.

ADD REPLY
1
Entering edit mode

That might be difficult. Maybe you could either look for local HPC resources/check out Amazon EC2? The latter option could work for you as you could "rent" a 32GB RAM virtual node, install Ubuntu on it and use it for as many hours as you need to get your work done.

ADD REPLY
0
Entering edit mode

Ok I will try @RamRS Thanks

Many people hurt me today bcz of my memory issue.

But it's ok Bro.

ADD REPLY
1
Entering edit mode

Your request crossed a professional boundary, so people responded to that. Do not take that as a personal attack - it is not one.

Your request should have been "How can I get this done, I don't have sufficient computational resources.", not "Can you do everything end to end for me so I can put it in my thesis".

The former shows a willingness to figure out how to solve a problem, the latter looks like you're trying to offload your work.

ADD REPLY
0
Entering edit mode

@RamRS Ok Bro Thanks a lot! Next time, I will write more meaningful sentences.

ADD REPLY
2
Entering edit mode

Yes, I need you to do the whole process for me including all the graphs, bcz I will put this work in my thesis.

Are you joking?

ADD REPLY
1
Entering edit mode

aouichechaimaa

Yes, I need you to do the whole process for me including all the graphs, bcz I will put this work in my thesis.

That is not what this forum is for.

ADD REPLY
0
Entering edit mode

@ jrj.healey plz remove my name and thanks it's my mistake. I just ask for help CZ i don't have enough memory.

ADD REPLY
1
Entering edit mode

That's why we write down our methods in science...

ADD REPLY
0
Entering edit mode

Yes i need your help. Thanks bro

ADD REPLY
0
Entering edit mode

@Kevin Blighe Hello, Bro where are you today I'm waiting for your help plz!

ADD REPLY
1
Entering edit mode

You will need a very powerful computer to process the BRCA data from Broad Firebrowse because it is the largest TCGA cohort. You may even have to process it on a cluster environment via a scheduling system, requesting a large amount of RAM (~4GB). I cannot provide these resources to you. So, you will have to contact your supervisor.

ADD REPLY
0
Entering edit mode

@Kevin Blighe Thanks Kevin for your kind response and your understanding too. So plz any of the cancers mentions in Firebrowse can work in the laptop or in limited memory?

Thanks and sorry for letting you help me with this issue.

ADD REPLY
0
Entering edit mode

ADD REPLY
1
Entering edit mode

@Kevin Blighe Ok Bro I'm trying now with other cancers. Actually, my main goal is to extract the significant genes from those recurrent CNA regions and then i can consider these genes as biomarkers.

These signature genes can be used to construct a biological modules which can be also considered as biomarkers and my final goal is to construct a pathway network from those genes

So, I just need as you mention in your code The somatic recurrent CNA and their corresponding aberrant genes.

Anyway, I would like to thank you from my heart about the help you gave me:!

Thanks a lot.

ADD REPLY
1
Entering edit mode

Best of luck. Please come again if you require more help / guidance.

ADD REPLY
0
Entering edit mode

Thanks, @Kevin Blighe So nice from you!

ADD REPLY
0
Entering edit mode

Hi @Kevin Blighe I am getting a similar plot like the one produced by Chimaa, seems to be that only amplifications or deletions show up in the plot, all commands seem to run without any errors, exactly same steps followed form part I, part II and part III. Could you help with it?

Thank you

ADD REPLY

Login before adding your answer.

Traffic: 2443 users visited in the last hour
Help About
FAQ
Access RSS
API
Stats

Use of this site constitutes acceptance of our User Agreement and Privacy Policy.

Powered by the version 2.3.6