Pvalue Histgram is a Bit U Shaped for Binom.test
1
0
Entering edit mode
5.7 years ago
afli ▴ 190

Hi everyone, I have a question about binomial test. Suppose there are thousands of coins, some of them are not homogeneous, I flip each coin with various trials, so each coin recieves the number of heads and tails. Then I do binom.test in r to see if I can find the specific coins. (I made this example which is similar with my reseach project, this is simple)

I get the following result:

enter image description here

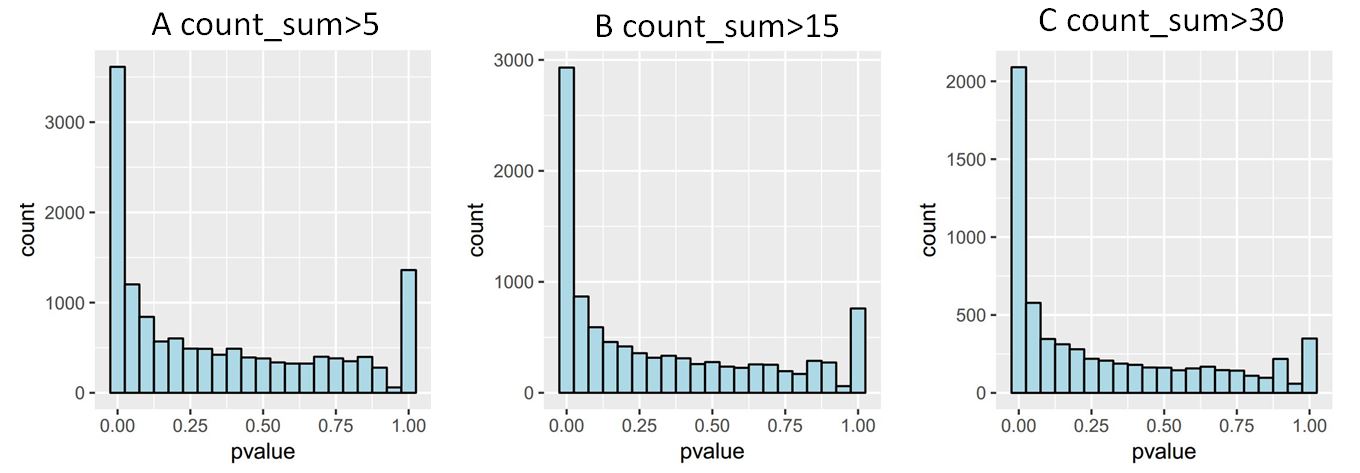
If I filter the counts with more than 5, I get a pvalue distribution of U shape, but if I do more rigorous filtering, the proportion near 1 is decreased. I use the two side method in binom.test. I have two questions.

Why does this U shape occur? Could I proceed my analyse just use count_sum>30?

Thank you! Aifu.

Pvalue Binom.test • 1.2k views
ADD COMMENT
0
Entering edit mode

I've seen the related explanation in http://varianceexplained.org/statistics/interpreting-pvalue-histogram/ but I'm still confused with this.

ADD REPLY
0
Entering edit mode
5.7 years ago

Statistical power scales with counts, so by only filtering for >5 counts you're leaving in a number of "coins" for which you lack power to find a difference even if there actually is one. This is the reason behind things like "independent filtering" in packages like DESeq2, since there's no point testing things for which you have insufficient power to begin with.

ADD COMMENT
0
Entering edit mode

Thanks a lot Devon. Actually, I've done the 'flip coins' three times(each time with all these coins), I find that if I do binom.test(counts>30) for each replicate, there is ~2000 coins with padj<0.05, but the overlapped coins of these three is just ~900.

I also do this using DEseq2(a very good software), with two conditions(head or tail) and each of three replicates, I find that ~2000 coins have padj<0.1.

Then I add up the counts of three replicates for head and tail, separately. And do binom.test(counts>60) again, this time with ~2000 coins too. The overlap coins between binom.test and DESeq2 is 83%. This means that low counts may not have enough power to discover the difference, just as you said. Besides, DESeq2 and binom.test have ~300 inhomogeneous coins in addtion to the overlap. I would adopt the DESeq2 result since I think it is more reliable.

ADD REPLY

Login before adding your answer.

Traffic: 1604 users visited in the last hour
Help About
FAQ
Access RSS
API
Stats

Use of this site constitutes acceptance of our User Agreement and Privacy Policy.

Powered by the version 2.3.6