R - Multiple boxplots
3
0
Entering edit mode
5.7 years ago
oars ▴ 200

Hello - I'm using the ALL dataset from the Bioconductor suite. I'm trying to create a simple graph with 5 separate boxplots that represent the different gene expression between M/F. I can create a single boxplot without any trouble:

boxplot(exprs(ALL)["1043_s_at",]~pData(ALL)$sex)

But when I add another gene I get an error? I thought my syntax looked clean?

> boxplot(exprs(ALL)["1043_s_at","38354_at",]~pData(ALL)$sex)
Error in exprs(ALL)["1043_s_at", "38354_at", ] : 
  incorrect number of dimensions

Anyone see a glaring issue with my code?

R Bioconductor • 24k views
ADD COMMENT
2
Entering edit mode
5.7 years ago
Ram 43k

You would either need to use facets or generate multiple plots and arrange them using gridExtra::arrangeGrob().

See: https://stackoverflow.com/questions/21388845/ggplot-arranging-boxplots-of-multiple-y-variables-for-each-group-of-a-continuou

ADD COMMENT
0
Entering edit mode

ok, thanks! It's a shame this is not a native capability for R.

ADD REPLY
1
Entering edit mode

ggplot2 is so common it might well be part of base R. You might want to have library(tidyverse) as the first command of any R session.

ADD REPLY
1
Entering edit mode
5.7 years ago
piyushjo ▴ 700

You can use ggplot boxplot

geom.boxplot("data",aes(x="put list of genes as factors",y="data",fill="the same gene list as factors"))
ADD COMMENT
0
Entering edit mode

Does this create multiple box plots or a single box plot with multiple colors?

ADD REPLY
0
Entering edit mode

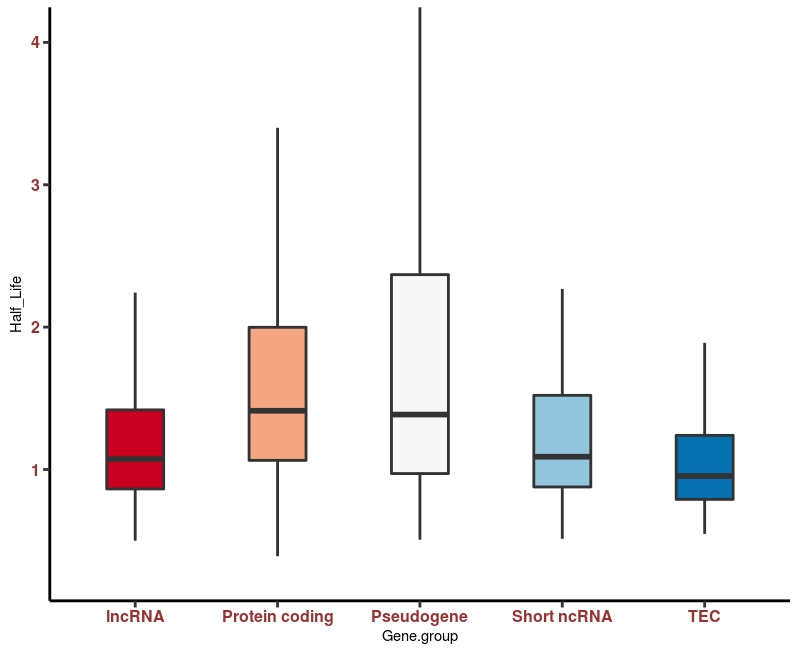
One box plot with multiple colors.

Ex:

p<-ggplot(dfa,aes(x=Gene.group,y=Half_Life,fill=Gene.group))+

geom_boxplot(position = position_dodge(.8),width=0.4, outlier.shape = NA,lwd=1) 

p+ theme_classic()+ #This is just to make it pretty!
  scale_fill_brewer(palette="RdBu" )+

 theme(plot.title = element_text( hjust=0.5, size=14, face="bold.italic"),    
        axis.text.x = element_text(color = "#993333",face = "bold",size=12),#adjsut height,angle
        axis.text.y = element_text(color = "#993333",face = "bold",size=12),
        axis.line = element_line(size = 1),
        axis.ticks = element_line(size = 1),axis.ticks.length = unit(5,"pt"),
        legend.position ="none" )+    
coord_fixed(ylim = ylim1*1.05,xlim = c(1:5)) # I set ylim this up other place in the code
ADD REPLY
0
Entering edit mode
ADD REPLY
0
Entering edit mode

See: How to add images to a Biostars post

Code to include your image (needs direct URL to image):

![bar plot][1]


  [1]: https://s22.postimg.cc/u13qmx2tt/a211_all.jpg

which renders the image as:

bar plot

ADD REPLY
0
Entering edit mode

Thanks! First time attaching file.

ADD REPLY
1
Entering edit mode
5.7 years ago

For basic plotting, you can use par(mfrow=c(1,5)) for 5 boxplots in a window. Example code for 2 below:

par(mfrow=c(1,2))
lapply(c("1043_s_at","38354_at"), function(x) boxplot(exprs(ALL)[x,]~pData(ALL)$sex, main=paste0("Expression of ",x), col=rainbow(2)))
dev.off()

Rplot

There are two issues in your code:

  1. subsetting was incorrect. You were supposed to use c() for subsetting rows from a dataframe
  2. Box plot accepts only one y when you are plotting against a factor (one Y in Y ~ X formula). You were passing two arguments that too with incorrect subsetting. Even if boxplot accepts two y values (which it doesn't), you code will fail because of incorrect subsetting.

If you don't want to use, apply functions, you can use following for two boxplots:

par(mfrow=c(1,2))
boxplot(exprs(ALL)["1043_s_at",]~pData(ALL)$sex)
boxplot(exprs(ALL)["38354_at",]~pData(ALL)$sex)
ADD COMMENT
0
Entering edit mode

Many thanks, I tried 3 for starters and got an error right away.

> par(mfrow=c(1,2,3))
Error in par(mfrow = c(1, 2, 3)) :
ADD REPLY
1
Entering edit mode

it is par(mfrow=c(1,3). Syntax for mfrow is mfrow=c(rows, columns). rows = number of rows wanted in the graph and columns=number of columns wanted in the graph. Let us say, you are plotting 3 bar plots. They can be row wise, column wise and both.

  • row wise (i.e 1 row, 3 columns - all the figures are horizontally laid out) - mfrow=c(1,3)
  • column wise (i.e 3 rows, 1 column - all the figures are vertically laid out) - mfrow=c(3,1)
  • mix layout (i.e first two in top row, last in bottom - asymmetrical for 3) - mfrow=c(2,2)
ADD REPLY
0
Entering edit mode

Both basic plotting and lattice plots support multiple boxplots. Following is example with lattice plot.

Rplot

library(ALL)
data(ALL)
probes=sample(row.names(exprs(ALL)),6)
library(lattice)
lapply(probes, function(x) bwplot(exprs(ALL)[x,]~pData(ALL)$sex|probes ,scales = list(y = "free")))
ADD REPLY

Login before adding your answer.

Traffic: 2366 users visited in the last hour
Help About
FAQ
Access RSS
API
Stats

Use of this site constitutes acceptance of our User Agreement and Privacy Policy.

Powered by the version 2.3.6