Entering edit mode

6.2 years ago
Qingyang Xiao
▴
160
Hello! As clustering methods, what's the main difference between tSNE and PCA analysis?
Hello! As clustering methods, what's the main difference between tSNE and PCA analysis?

The main difference between t-SNE (or other manifold learning methods) and PCA is that t-SNE tries to deconvolute relationships between neighbors in high-dimensional data.
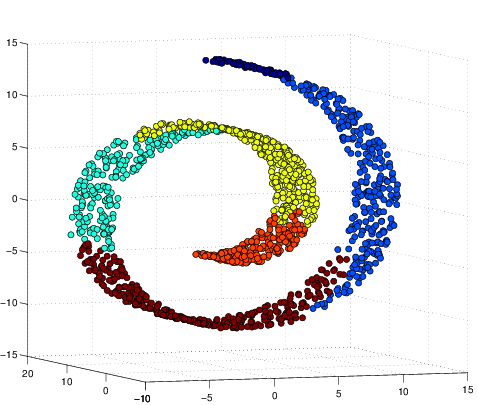
A classic example is the "swiss roll". To put the difference in layman's terms: t-SNE attempts to understand the underlying structure of the swiss roll. It does this by prioritizing neighboring points. PCA doesn't get what's going on - it doesn't see that the points are actually a line that's been rolled up.
Original data:
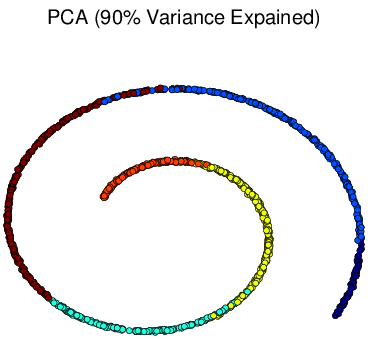
This PCA sucks (it thinks yellow is close to blue when in fact they are far away):
In contrast, see how t-SNE seems to understand what's going on with this 'S'?
Jeremy Leipzig Are you able to re-upload the t-SNE picture?
Looks like the link has been changed and hence, the image is missing.

I can suggest some links that will give you the flavor of both the methods that are used in dimensionality reduction.

Just a couple of comments... Neither tSNE or PCA are clustering methods even if in practice you can use them to see if/how your data form clusters. tSNE works downstream to PCA since it first computes the first n principal components and then maps these n dimensions to a 2D space. The original paper on tSNE is relatively accessible and if I remember correctly it has some discussion on PCA vs tSNE. Also, this post on tSNE is quite good, although not really about tSNE vs PCA.
Use of this site constitutes acceptance of our User Agreement and Privacy Policy.

Other than the math?
Yes, other than math, mainly for biological applications
It is used for dimensionality reduction and now depending upon variables and your interest of inferencing the applications will be considered. PCA has been a pretty favorite tool till date for RNA-Seq , ChIP-Seq and also WES data, but with incoming scRNASeq and also large scale SNPs data scoring population genetic inferencing t-SNE is coming handy as well. The links I have already given below in the answer should suffice. Now I will post here one more w.r.t Human Genetic Data. Your question is too broad so probably you need to do some background study. Rest it all depends on the data you will be using and depending on that your methods for dimensionality reduction will be coming into consideration.
Nonsense - the question isn't too broad. If someone just asks for the "main difference" you should be able to explain it in a sentence or two instead of bombarding them with links.
I guess you have to check what the OP wrote in comments as biological application.
Many thanks to these fascinating answers!