Ok, then the only option is to run it independently with -bga and then -bga -split and cross compare the files to get the difference. I was in search of a flag. Anyway thanks for your comments.
It is not possible to distinguish between gaps of coverage and split alignments using the output format of bedtools genomecov or the standard BED format.
In an ongoing project, we are using an ad-hoc format where coordinate blocks are separated by commas to indicate a confidently-predicted intron, by a semicolon to indicate lower confidence, and by a pipe character to indicate a gap of coverage. Strand is indicated by the order of start and end position (start > end for plus, and start < end for minus).
If a multiline output format is acceptable, it may be possible to represent the same information with a GFF format.
Is that the kind of output that you are looking for ?

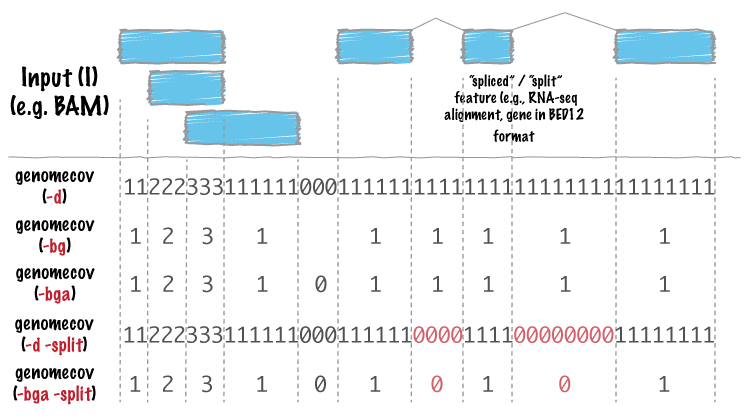

Apparently using 'genomecov -d' and 'genomecov -d -split' would do it, as indicated by this graph.
Ok, then the only option is to run it independently with -bga and then -bga -split and cross compare the files to get the difference. I was in search of a flag. Anyway thanks for your comments.