
This tutorial makes use of the GenVisR package. Please cite:
Skidmore ZL, Wagner AH, Lesurf R, Campbell KM, Kunisaki J, Griffith OL, Griffith M. 2016. GenVisR: Genomic Visualizations in R. Bioinformatics. pii: btw325. [Epub ahead of print]
PubMed | Bioinformatics Journal | BioRxiv | Bioconductor | GitHub
Note: A more comprehensive version of this tutorial is also available as part of our Genomic Visualization and Interpretation course at www.genviz.org.
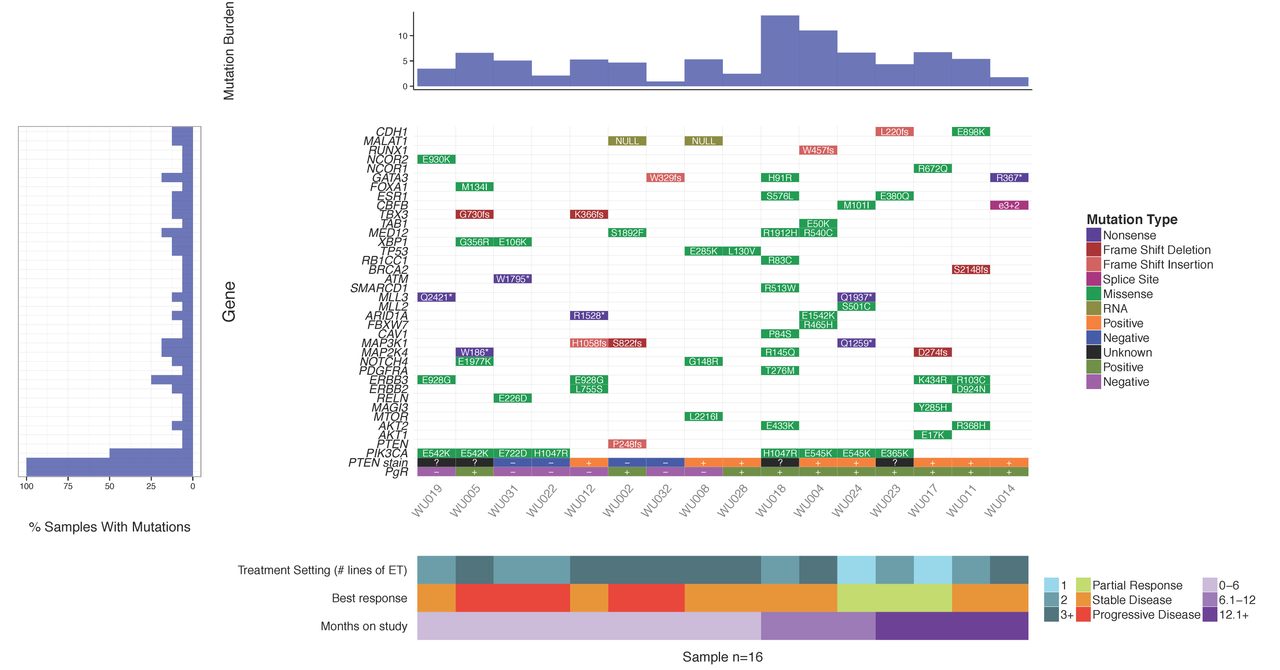
Upon sequencing a set of tumor samples, from small to large cohorts, a common first step is to analyze/visualize the recurrence and co-occurrence of gene-level mutations. If you look in almost any recent TCGA or ICGC paper you will find plots similar to the example below where a matrix of genes by samples is shown with mutation type indicated by coloring of each matrix cell. It is also often common to add sidebars for relevant clinical details, gene mutation rate, and/or sample mutation burden. There are some web-based tools that now allow you to create such views for pre-loaded data. For example, the cBioPortal provides such visualizations for much of their pre-loaded TCGA and ICGC data and their excellent OncoPrinter tool also allows custom data input. However, in many cases, producing publication-ready waterfall plots requires further customization. Such custom plots have historically been created through ad hoc R plotting or even manually in Excel (yikes!). In other cases, automated generation of plots for multiple sets of genes (e.g., pathway by pathway views) is desired. To address the needs for automation, customization and accessibility we have created the GenVisR package for Genomic Visualizations in R. The waterfall function is just one of many convenient functions for the production of highly customizable publication quality graphics for genomic data primarily at the cohort level.
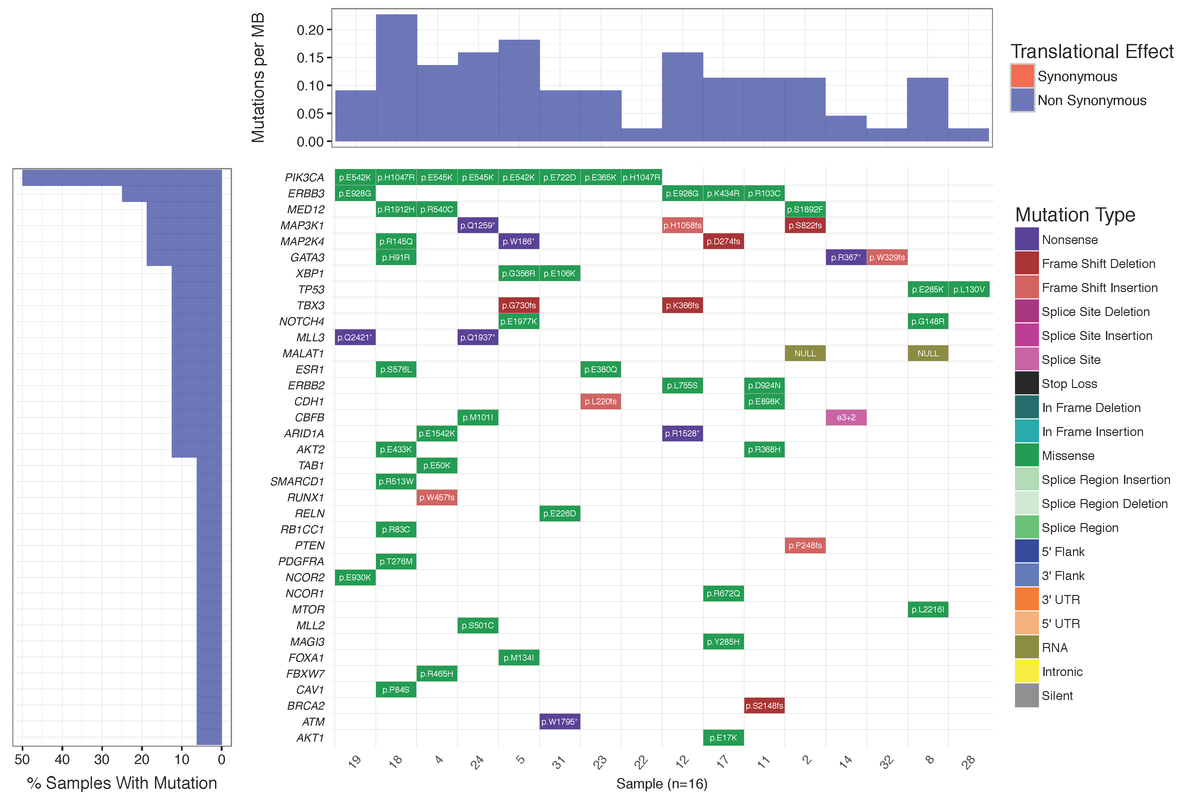
In this tutorial we will demonstrate the use of the GenVisR waterfall function. We will recreate such a plot as that shown below and recently published in Ma et al (2015).
The first required step is to install GenVisR. First, make sure that you have the latest version of R (3.3.0 or later) available from CRAN and launch an R session. GenVisR is available through BioConductor and can be installed by the usual method. At an R prompt, we will install GenVisR and load the GenVisR library as follows:
source("https://bioconductor.org/biocLite.R")
biocLite("GenVisR")
library(GenVisR)
Now, lets get the mutation data for Ma et al 2015. This is available as Supplementary Table S3 at the paper's Supplementary Data page. I opened this excel file and saved it as a tab-delimited text file for import into R. Take note of where you saved that file and import it into R. The read.table function is a useful tool for this purpose.
mutation_data=read.table(file="~/Downloads/152934_1_supp_3139930_n6h2q6.txt", header=TRUE, sep="\t")
We will need to rename the column headings for “patient”, “gene name”, and “trv type” to one of the sets of supported column headings (see ?waterfall for examples). Note that the trv_types (mutation types) in this case follow the style of the MGI annotator as documented here. Other formats (standard MAF or custom) are also supported.
colnames(mutation_data)[c(1,8,12)]=c("sample","gene_name","trv_type")
Finally, let's run the waterfall command. Note, a few options are specified to add x-axis labels and cell labels.
pdf(file="~/Dropbox/BioStars/GenVisR_waterfall_example1.pdf", width=12, height=8)
waterfall(mutation_data, fileType="MGI", mainXlabel=TRUE, mainLabelCol="amino.acid.change", mainLabelSize=2)
dev.off()
You should see a waterfall plot very similar to that published in Ma et al (2015).
GenVisR Tutorials currently available at BioStars:


Thanks a zillion!
I scanned quickly the paper trying to find the meaning behind: Normal.ref.count, Normal.var.count, Normal.VAF, Tumor.ref.count, Tumor.var.count, Tumor.VAF. Unfortunately I couldn't. Sorry if this sounds a very simple question but VAF can have a lot of meaning in my genetic dictionary ;) and count could also mean a lot of things to me ... so, would you kindly explain it?
Thank you again
VAF in this case refers to variant allele fraction (frequency). "ref.count" is the number of reads supporting the reference allele. "var.count" is the number of reads supporting the variant allele. VAF = var.count/(ref.count+var.count).
Dear Obi,
Can we add the percentage of mutation for each gene per sample on this plot?
Kind Regards, Rahel
I'm not sure what you are asking. Do you mean the variant allele frequency for each gene/sample? As a text value in each cell? Or, something else?
Dear Obi, Many thanks for your reply. Yes, I mean that to add the VAF to each cell. I have this AF value in mutect2 out put and also %frequency from Varscan2 output, I figured out that I can add them as separate column in my input data and then add it to the watefall command, but I am not sure if it is correct. Is there any way to extract the VAF values for each cell (gene per sample) from GenVisR and tell the command to write the VAF value on each cell? Kind regards, Rahel
Yes. Just look at the format of the "mutation_data" object. If you can add another column with VAF values then you should be able to just specify mainLabelCol="X" where X is the name of your new VAF column rather instead of "amino.acid.change".
Hi Griffith,
The mutation data which I'm using has
Is filetype "Custom" ? And when I run the data I got the following error:
P.S: I see that in "Variant_class" there are also "NA"s. Could you please help me in this.
Thanks in Advance
Hi dsp,
you mention the original input has NA's, are those in the "variant_class" column? If so adding NA to the most_deleterious variable should resolve the issue: most_deleterious <- c("missense SNV","frameshift indel","nonsense SNV","inframe indel","stoploss","synonymous SNV", NA)
Thanks for the reply. It worked.
Dear Griffith, Is there a way to plot the "Mutations per MB" in a separate plot not as a part of Waterfall using GeneVisR? Something like figure 1 in Alexandrov et al., 2016 https://d2ufo47lrtsv5s.cloudfront.net/content/sci/354/6312/618/F1.large.jpg Please let me know if I had to make a new question for this ... Many thanks in advance, Rahel
Hi Rahel,
The link which you posted is not working. If you want to give an image Go to (https://imgsafe.org/) and browse the image u need, copy the link.
Above the comment box, click the image and Paste the link you copied before. Better create a new question.
Thank you
Many thanks for your advice. I did create a new question for that: Plotting numbers of somatic substitutions per megabase (MB)
Dear Obi, I have some cases that do not have mutation for my candidate genes (NaN or NA), but I still want these cases to be present in the plot,do you know how should I format the input data?
Depending on the version of GenVisR you are using there are two options, using GenVisR's internal dataset as an example:
option 1. use the plot samples parameter
option 2. make a dataframe with those samples, NA out everything else
Thanks for kind explanation! I would like to ask a one more question. Is there any other option to enlarge the size of sample name, I mean, the size of x-axis label?
Best, Caroline
You could do that indirectly, because all of the plots in GenVisR are based on ggplot2 you can just add a layer, something like this should work
Oh, I should try it! Thanks a lot :)
Dear @zlskidmore Is it possible to remove the bar plot of %Mutant in the y lab and just keep the gene name? As I am considering only 5 genes it is not necessary and take space. How can I make any changes in the %Mutant plot? I really appreciate your time and help!
How can I change the gridlines? I tried with mainLayer = theme(.....), but major grid is showing in the middle of the divisions, and minor grid is not showing at all. I just want to change the grid lines of the main graph for black lines with specific sizes!
How can I change the gridlines? I tried with mainLayer = theme(.....), but major grid is showing in the middle of the divisions, and minor grid is not showing at all. I just want to change the grid lines of the main graph for black lines with specific sizes!
Many thanks @Obi Griffith for this nice tutorial. Is it possible to remove the bar plot of %Mutant in the y lab and just keep the gene name? As I am considering only 5 genes it is not necessary and take space.
Hi @Obi, How can we change the size of text in the x-axis of %Mutant plot next to the main plot? I tried to do it by theme but didn't work. Many thanks!
Fantastic tool, thank you very much Griffiths lab (Obi Griffith, zlskidmore, Malachi Griffith ). I have a question:
Is it possible to visualise the different mutations falling in the same gene in a given sample on a waterfall plot? I can give an example, using the waterfall plot given in this tutorial. If we assume that sample 19 has 2 different missense mutations in PIK3CA (p.E542K and something else), is it possible to visualise the two in the same waterfall plot (for example, a second row for PIK3CA)?
Best wishes.
Hi, thanks for this wonderful tool! I have a question Obi Griffith I am trying to install the library GenVisR like the tutorial above, but even with the old versions of R, it is not installing, I tried several tutorials and in countless ways, but I am not able to solve the installation of the library. He always return similar message:
I hope someone can help me.
Hi Obi Griffith ,
Hoping you can help me with this error whilst trying to plot this.
I am wondering if my data is in the wrong format, I do have 20k rows however these are repeats of the same samples (BRCA cell lines) but with different gene mutations. There are about 20 unique cell lines in the sample col.
Hopefully that makes sense and you can point me in the right direction :)
Amy